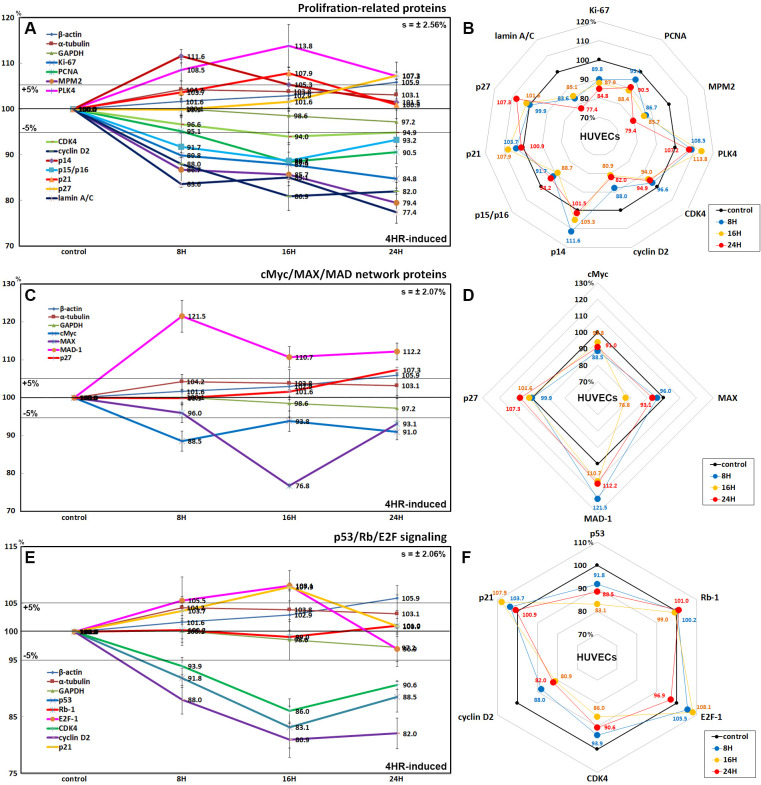
Fig 5.
Expression of proliferation-related proteins (A and B), cMyc/MAX/MAD network proteins (C and D), and p53/Rb/E2F signaling proteins (E and F) in 4HR-treated HUVECs as determined by IP-HPLC. Line graphs, A, C, and E show protein expression on the same scale (%) versus culture time (8, 16, or 24 h), whereas the star plots (B, D, and F) showed the differential expression levels of the proteins at 8, 16, or 24 h after 4HR administration on the appropriate scales (%). The thick black line, untreated controls (100%); the orange, pink, and red dots show differential protein levels after 4HR administration for 8, 16, or 24 h, respectively.

