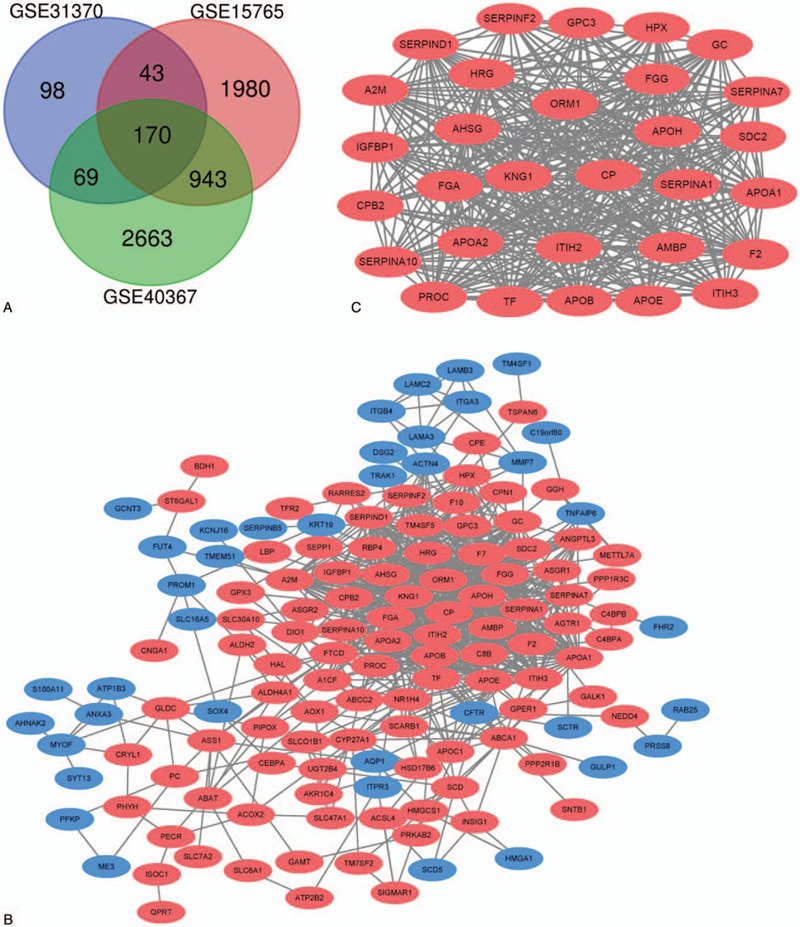
Figure 2.

A. Venn diagram of the common DEGs shared by 3 GSEs. DEGs were selected with | log FC (fold change) | > = 1.0 and P value < .05 among the GSE31370, GSE15765, GSE40367. The 3 datasets showed an overlap of 171 genes. B. The PPI network of DEGs was constructed using Cytoscape. C. The most significant module was obtained from PPI network with 30 nodes and 369 edges. Upregulated genes are marked in red; downregulated genes are marked in blue.
