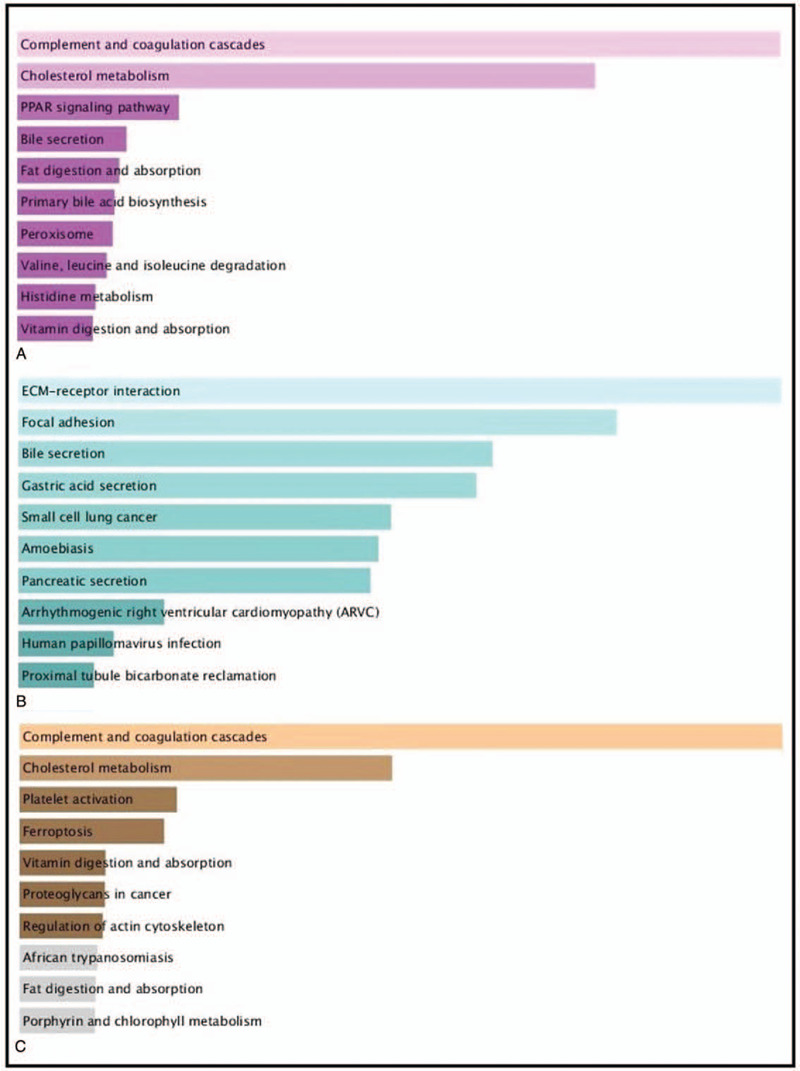
Figure 3.

KEGG pathway enrichment analysis between LIHC and CHOL. A KEGG pathway enrichment analysis of upregulated expressed genes between LIHC and CHOL (pink bars). B KEGG pathway enrichment analysis of downregulated expressed genes between LIHC and CHOL (green bars). C KEGG pathway enrichment analysis of DEGs in the most significant module (yellow bars).
