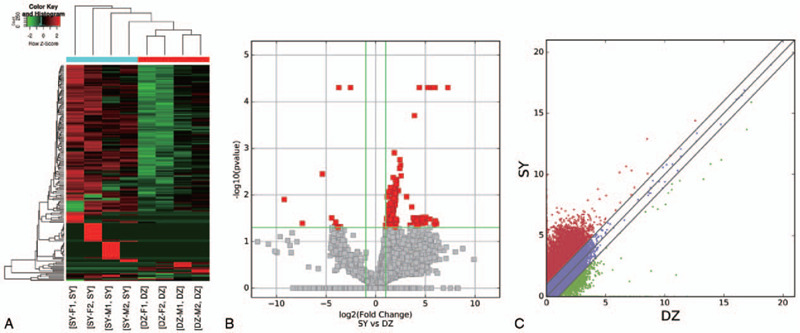
Figure 1.

Differences in lncRNAs expression profiles between the acute ischemia stroke and sham groups. (A) Hierarchical cluster analysis of 44,578 differentially expressed lncRNAs. Each column represents one sample; each row represents one differentially expressed lncRNAs. Red strips represents up-regulated high relative expressions, green strips represents down-regulated expressions, and the deeper the color, the high the significant difference. The dendrogram on top shows the clustering of the samples. The dendrogram on the left shows the clustering of the genes. (B) Volcano plots show the distributions of lncRNAs between the acute ischemia stroke and sham groups. The horizontal line corresponds to a 5-fold (log5 scaled) change up or down, and the vertical line represents a P-value of <.05 (−log10 scaled). The red points on the plot represent the differentially expressed lncRNAs with a 5-fold change up or down in expressed lncRNAs with statistical significance (P < .05). (C) The scatter plot shows the differences in lncRNAs expression between the acute ischemia stroke and sham groups. The values plotted on the x and y axes are the averaged normalized signal values between the acute ischemia stroke and sham groups (log2 scaled). The gray lines represent fold change. The lncRNAs above the top gray line and below the bottom gray line indicate a >2 fold change of lncRNAs between the 2 compared samples. lncRNAs = long non-coding RNAs.
