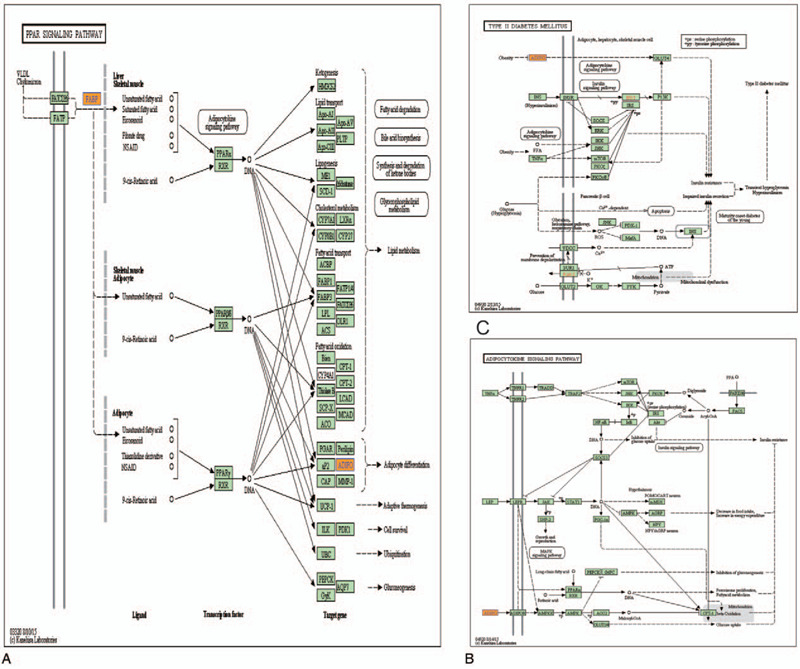
Figure 4.

Mapping of pathways of lncRNAs expression pattern involved in PPAR signaling pathway (A), Type II diabetes mellitus (B), and Adipocytokine signaling pathway (C). Yellow marked nodes are associated with down enriched genes, orange marked nodes are associated with up-regulated enriched genes, green nodes have no significance. lncRNAs = long non-coding RNAs; PPAR = peroxisome proliferator-activated receptor.
