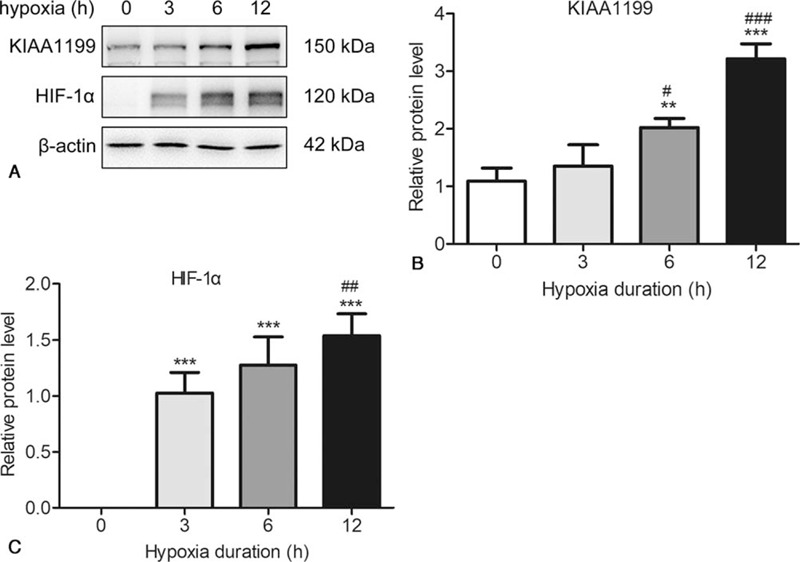
Figure 2.

The expression of KIAA1199 and HIF-1α in respond to hypoxia. HepG2 cells were exposed to hypoxia for 0, 3, 6, 9 and 12 h. The expressions of KIAA1199 and HIF-1α were measured by Western blotting (A) and quantified (B, C) using β-actin as control. The data are presented as the means ± SD, n = 3. ∗∗P < .01 & ∗∗∗P < .001 compared to 0 hour.
