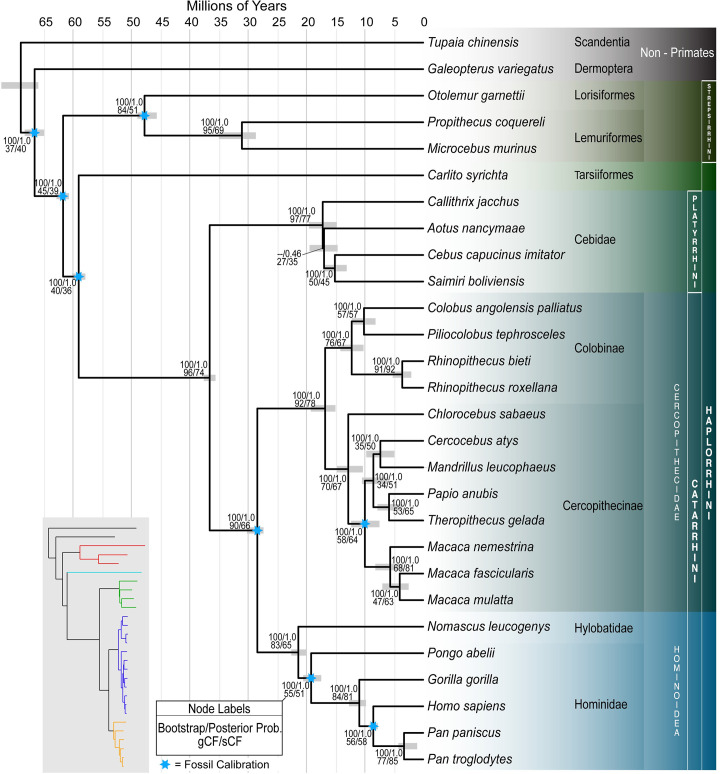
Fig 1. Species tree estimated using ASTRAL III with 1,730 gene trees (the Mus musculus outgroup was removed to allow for a visually finer scale).
Common names for each species can be found in S1 Table. Node labels indicate the bootstrap value from a maximum likelihood analysis of the concatenated dataset as well as the local posterior probability from the ASTRAL analysis. gCFs and sCFs are also reported. Eight fossil calibrations (blue stars; S6 Table) were used to calibrate node ages. Gray bars indicate the minimum and maximum mean age from independent dating estimates. The inset tree with colored branches shows the maximum likelihood branch lengths estimated using a partitioned analysis of the concatenated alignment. Colors correspond to red = Strepsirrhini, cyan = Tarsiiformes, green = Platyrrhini (NWMs), blue = Cercopithecoidea (OWMs), and orange = Hominoidea (Apes). All alignments used for phylogenomic analyses (1730_Alignments_FINAL.tar.gz) and dating analyses (All_Dating_Datasets_DRYAD.tar.gz) are available via Data Dryad: https://doi.org/10.5061/dryad.rfj6q577d [22]. gCF, gene concordance factor; NWM, New World monkey; OWM, Old World monkey; sCF, site concordance factor.

