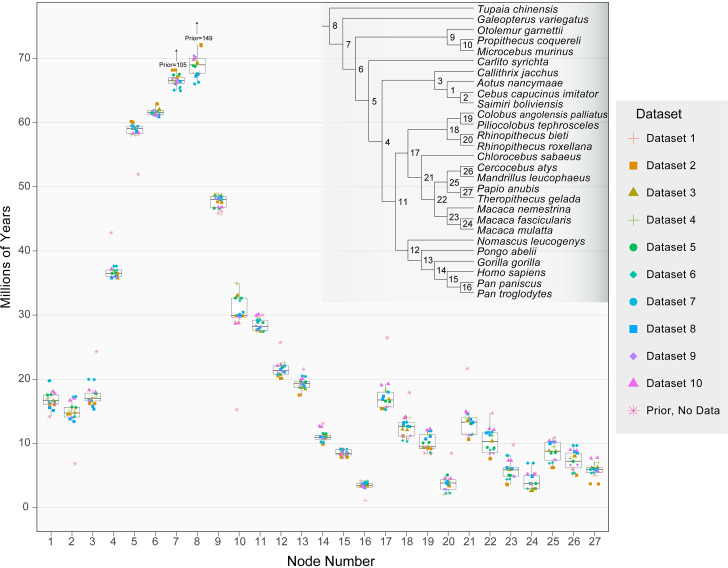
Fig 3. Mean node ages for independent Phylobayes dating runs.
Box plots show the median, interquartile range, and both minimum and maximum values of the mean nodes ages for 10 different datasets (with each dataset run twice). An additional run was performed with no sequence data to ascertain the prior on node divergence times in the presence of fossil calibrations (pink asterisks). Some prior ages were too large to include in the plot while still maintaining detail; these ages are given as numeric values. The species tree topology is from Fig 1; 95% HPD intervals for each node are reported in S7 Table. Node age estimates for each independent PhyloBayes run are provided in S1 Data. HPD, highest posterior density.

