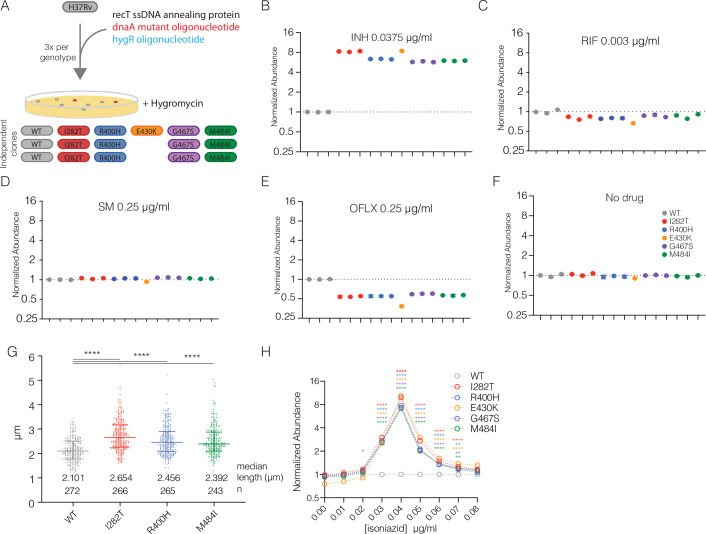
Fig 2. Isogenic dnaA mutants have altered INH susceptibility and cell cycle.
(A) Schematic of the H37Rv dnaA mutant construction. (B-F) Competition assay with relative abundance of each strain normalized to input after 6 days of growth in the indicated antibiotic conditions. The mean and standard deviation of three technical replicates is shown with each biologically independent strain shown separately. (G) Lengths of individual bacterial cells from the indicated strains during exponential growth at 2 days post-inoculation. Median and interquartile range shown with bars. Difference among medians tested by Dunn’s multiple comparison test after one-way non-parametic ANOVA. **** represents p < 0.0001. (H) Relative abundance of dnaA mutants across a range of INH concentrations. The mean of the three replicate strains (E430K n = 1) measured in triplicate cultures is shown. Error bars smaller than the symbols are omitted in D-I. Differences between each mutant and WT were tested by Dunnett’s multiple comparison test after two-way ANOVA. * <0.05, ** < 0.01, **** < 0.0001.

