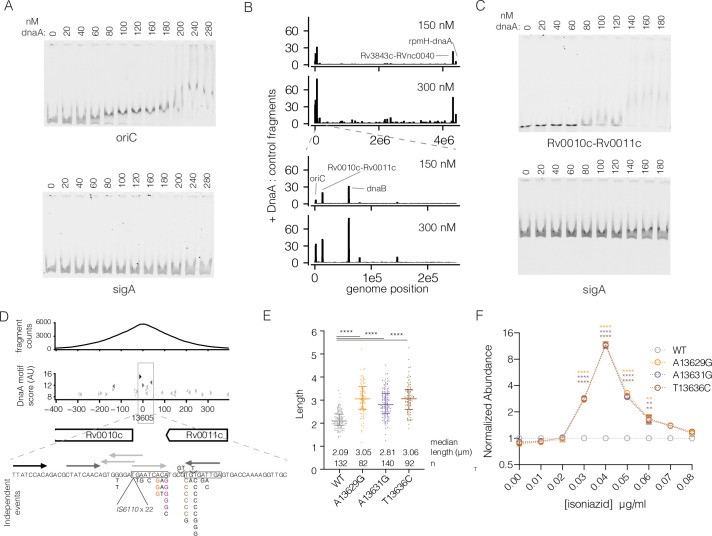
Fig 4. DnaA binds to Rv0010c-Rv0011c and common mutations phenocopy dnaA.
(A) Electromobility-shift assay with increasing concentration of dnaA protein using labeled oriC (top panel) or sigA (bottom panel) DNA fragments. Both fragments were labeled with a unique dye and mixed in a single reaction. Composite images were split (B) Genome-wide binding of WT dnaA protein across the genome. The regions shown were split into 1000 windows and the maximum enrichment score within that window is plotted. The bottom panel shows the first 200 kb of the genome to distinguish the three closely spaced peaks. (C) Electromobility-shift assay as in panel A substituting oriC for a 110bp fragment of Rv0010c-Rv0011c. (D) Detailed view of the Rv0010c-Rv0011c region. Top panel: normalized fragment counts of the dnaA pulldown. Middle panel: Potential dnaA binding sites based on a position weight matrix (S10 Table) derived from biochemically identified dnaA binding sites from [41]. Black arrows correspond to the top scoring binding sites at 0.01%, medium gray to 0.1% and light grey to 1%. Bottom panel: sequence view of potential DnaA binding sites with clinically present mutations annotated with number of independent acquisitions. (E) Lengths of individual bacterial cells from the indicated strains during exponential growth at 2 days post-inoculation. (F) Relative abundance of Rv0010c-Rv0011c mutants across a range of INH concentrations. The mean of individual strains measured in triplicate cultures is shown. Error bars smaller than the symbols are omitted. Differences between each mutant and WT were tested by Dunnett’s multiple comparison test after two-way ANOVA. ** p < 0.01, **** p < 0.0001.

