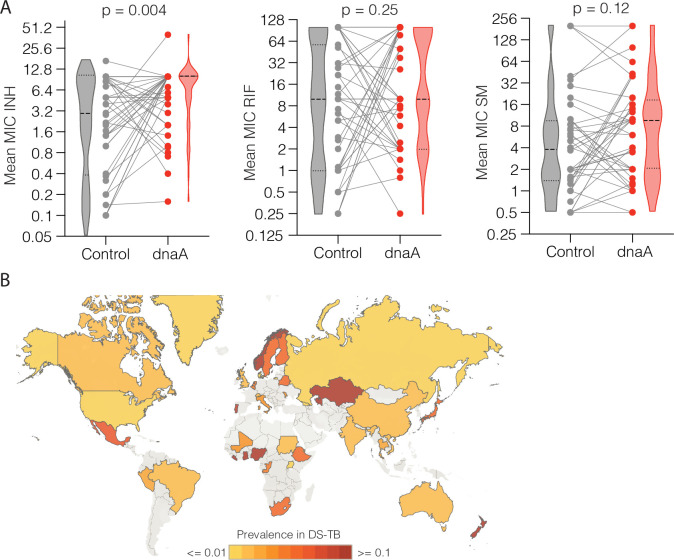
Fig 5. dnaA mutations coincide with increased INH MIC and are globally prevalent.
(A) Comparison of the mean MIC of phylogenetic clades bearing dnaA mutations (red dots) with their nearest non-mutant neighbors (gray dots). Strong and light dashed lines indicate the median and quartile values respectively. Gray lines indicate each independent phylogenetic contrast (INH n = 43, RIF n = 43, SM n = 41). Difference in distribution tested by two-tailed Wilcoxon matched-pairs signed rank test. (B) Global prevalence of non-synonymous dnaA variants in presumed drug susceptible strains. The map was generated using Tableau (https://www.tableau.com/).

