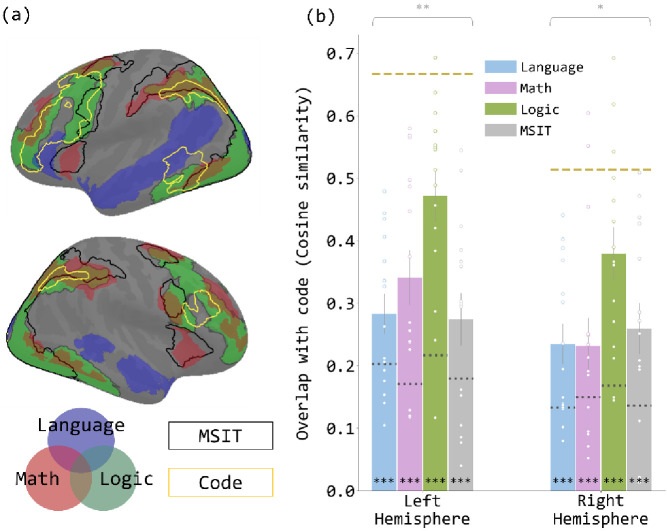
Figure 3. Overlap between the brain map revealed by the code contrast and each of the brain maps revealed by the localizer contrasts.
(a) Brain map with the activated regions in the five contrasts reported in Figure 1 overlain. The language network is shown in transparent blue, math in transparent red, and logic in transparent green. The regions activated in the MSIT contrast are enclosed in black outlines, and the code-responsive regions are enclosed in yellow outlines. (b) Cosine similarity between code contrast and each localizer contrast, in each hemisphere. Each dot represents the data from one participant. The dotted line on each bar indicates the null similarity between code contrast and the given localizer contrast. The yellow dashed line in each hemisphere indicates the empirical upper bound of the cosine similarity, the similarity between code comprehension and itself, averaged across participants. Error bars are mean ± SEM. *p<0.05. **p<0.01. ***p<0.001.

