
Figure 3. Subpopulations of insulin granules carry different synaptotagmin isoforms and have different physical and fusion properties that correlate with those observed after type-1 and type-2 diabetes model treatments.
(A) Flow chart for purifying insulin granules from INS 1-derived (GRINCH or INS 832/13) cells over a density gradient, assessing their syt content, and further separation by syt isoform immunodepletion. (B) Western blots of cell lysates for either syt7 or syt9 from untreated cells or cells treated with cytokines and palmitate (FFA); accompanying quantification (from three independent experiments) shows that syt concentrations are unchanged. Gamma-adaptin was used for normalization as previously (Hussain et al., 2018). (C) Western blot of insulin granule fractionation profiles from cells following different treatments; fraction nine was collected as granules. (D) Western blot (top) and quantification (bottom) of insulin granule supernatants following immunodepletion with anti-syt7 or syt9 antibodies (n = 3). (E) Size distributions of total (control) and syt7 or syt9 granules harvested from supernatants following immunodepletion of the other granule type and measured by cryo-EM (left) or FCS (right). (F) Insulin granule fusion with planar supported membranes as a function of calcium concentration. Total (control) granules (green), syt7 granules (blue) and syt9 granules (red). (G) Content release mode (as defined in Figure 1D and Figure 1—figure supplement 2) for syt7 and syt9 insulin granules in the presence of 100 µM calcium. Numerical data of single granule fusion experiments are presented in Figure 3—source data 1.

Figure 3—figure supplement 1. Calcium dependence of granule fusion efficiency is determined by syt isoform.
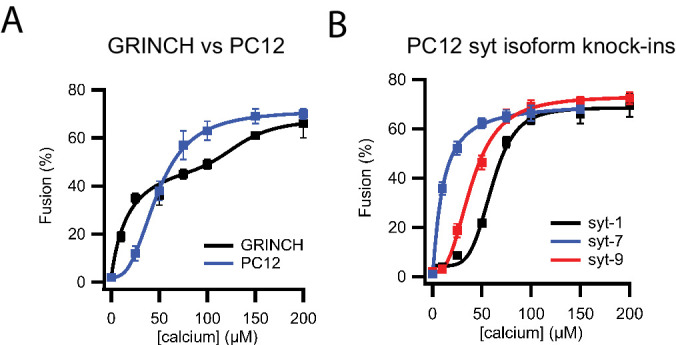
Figure 3—figure supplement 2. Release modes of PC12 dense core granules expressing only single synaptotagmin isoforms in a single vesicle/supported membrane fusion assay.
