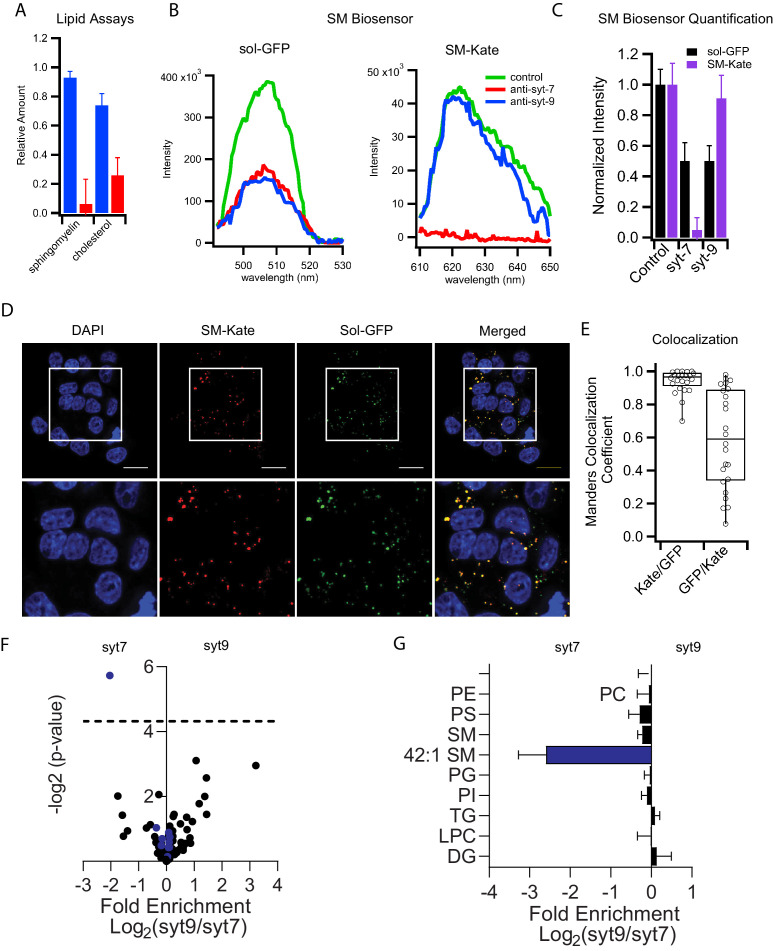
Figure 4. Syt7 and syt9 granule subpopulations have different lipid compositions.
(A) Cholesterol and sphingomyelin contents of syt7 (blue) and syt9 (red) granules measured in lipid extracts using colorimetric assays (Figure 4—figure supplement 1, error bars are standard deviation from three independent samples). (B) Fluorescence spectra of GFP or mKate of intact granules in control and immunodepleted syt7 or syt9 granules purified from INS 832/13 cells. (C) Quantification of the fluorescence (sol-GFP in black and SM-Kate in purple) in control and immunodepleted syt7 or syt9 granules. Numerical data are presented in Figure 4—source data 1. (D) Fluorescence of INS 832/13 cells expressing plasmids that label all granules in the secretory pathway (sol-GFP) and those enriched in sphingomyelin (SM-Kate). Scale bars are 10 μm. (E) The Manders colocalization coefficient defining co-localization of SM-Kate to GFP (Red/Green) or GFP to SM-Kate (Green/Red). Each dot represents a single cell. (F) Volcano plot of mass spectrometry data comparing relative levels of specific lipid species from syt7 and syt9 granules. Data (from Figure 4—source data 2) are expressed as a ratio syt9/syt7 such that values to the right of 0 indicate enrichment in syt9 granules relative to syt7 granules and values to the left of 0 indicate the reverse. The significance of each measurement is plotted on the vertical axis. Blue dots are sphingomyelin species and black dots are all other lipid species. The only lipid showing a significantly different distribution (-log p-value>4.31 (dotted line), that is p<0.05) is SM 42:1, which is enriched in syt7 granules. (G) Bar graph derived from the data in panel F summarizing the compositional differences by lipid class where the fold enrichment in syt7 or syt9 granules is plotted, respectively, to the left and right of 0. At least three independent samples of syt7 and syt9 granules were analyzed by mass spectrometry (see Figure 4—source data 3).


