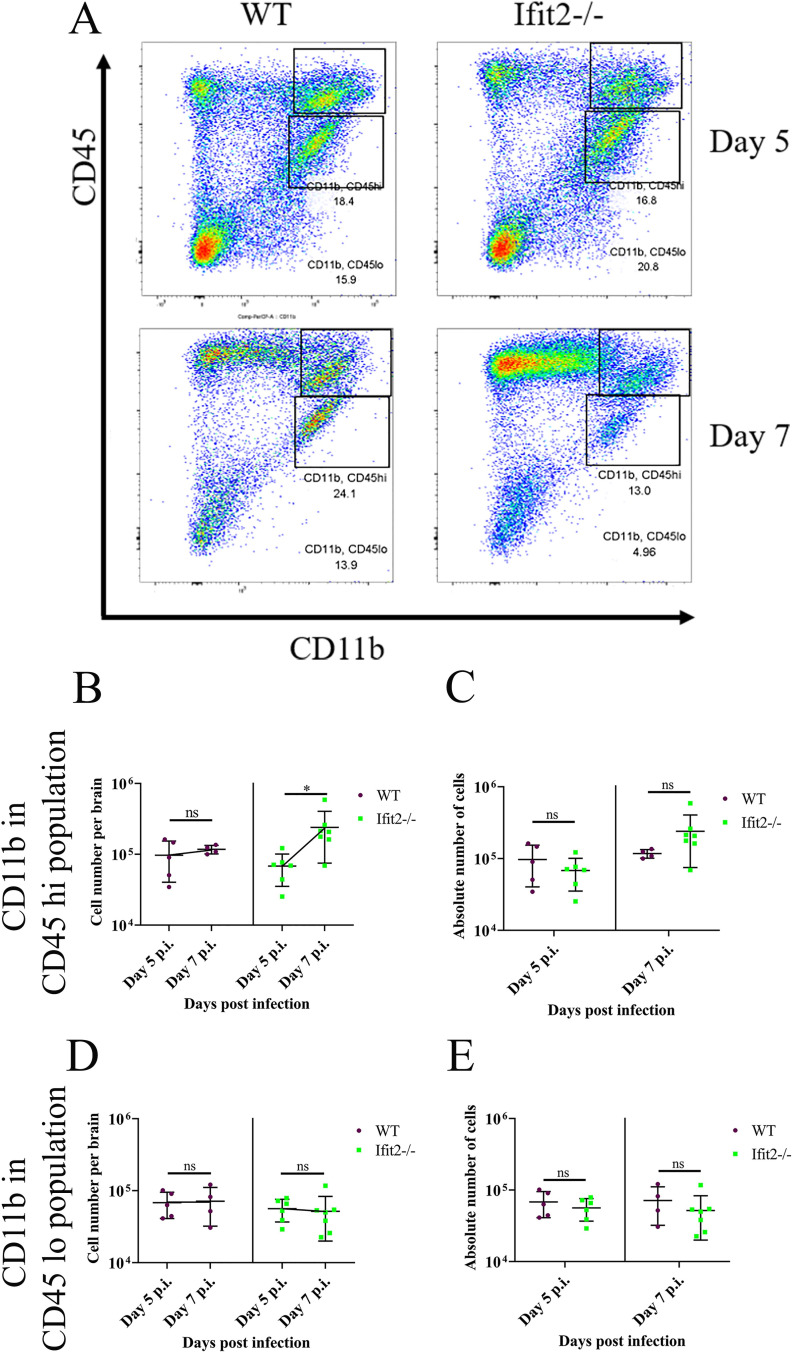
Fig 7. Ifit2 deficiency does not alter myeloid cell populations in the brain.
Cell suspensions from brains of infected WT and Ifit2-/- mice were analysed as described in Fig 6 by flow cytometry, following staining for CD45 and the myeloid marker CD11b. Panel A shows representative flow cytometry plots, indicating percentages of CD11b+CD45hi and CD11b+CD45lo cells at days 5 and day 7 p.i. Absolute numbers of CD11b+CD45hi cells are graphically represented across timepoints (Panel B) and in between WT and Ifit2-/- groups for day 5 p.i., and day 7 p.i. (Panel C) to better represent respective statistics. Similarly, absolute numbers of CD11b+CD45lo cells are graphically represented for same group at each timepoint (Panel D) and in between WT ad Ifit2-/- groups at two timepoints (Panel E). Graphs represent n = 4–7 mice and the experiment were repeated 2–3 times. Asterix (*) represents differences that are statistically significant by Student’s unpaired t-test analysis. (*P<0.05).

