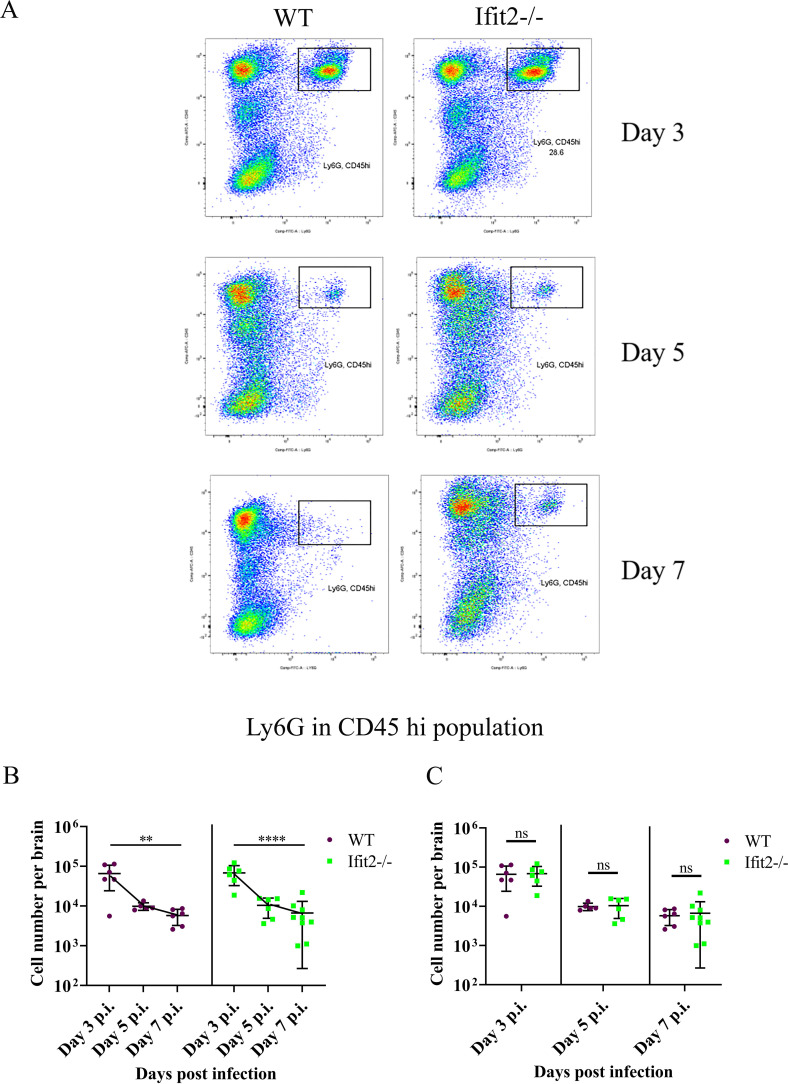
Fig 8. Ifit2 deficiency does not alter neutrophil migration into the CNS.
Cell suspensions from brains of infected WT and Ifit2-/- mice were analysed as described in Fig 6 by flow cytometry following staining for CD45 and the neutrophil marker Ly6G. Panel A shows representative flow cytometry plots at days 3,5,and 7 p.i. Absolute numbers of Ly6G+CD45hi cells are graphically represented across timepoints for each group (Panel B) and between WT and Ifit2-/- groups for day 3 p.i., 5 p.i., and day 7 p.i. (Panel C) to better represent respective statistics. The experiment is repeated twice and representative graphs are presented with n = 5–9. Asterix (*) represents differences that are statistically significant by Student’s unpaired t-test analysis. (**P<0.01, ****P<0.0001).

