
Figure 7. Anemia is linked to changes in immunophenotype and iron availability directly impacts B cell biology.
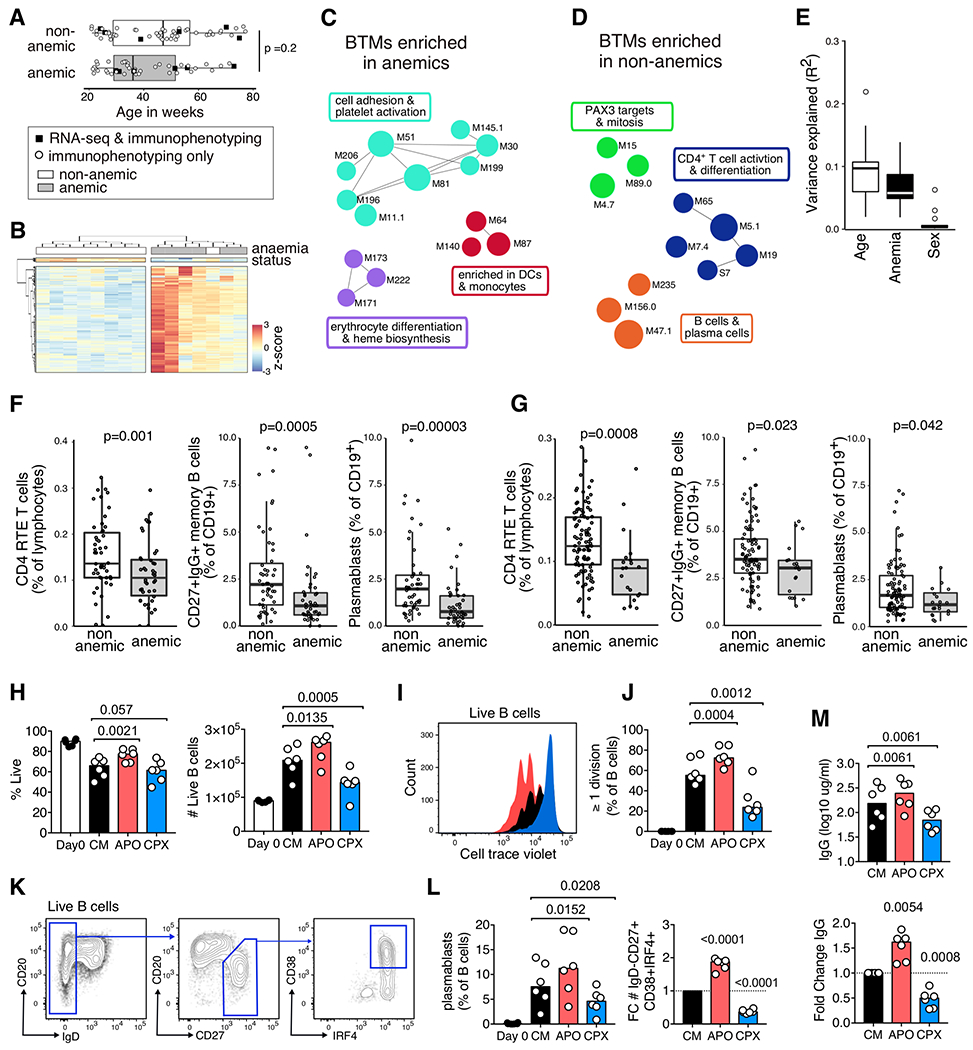
A) The age of anemic (<8.5g/dL hemoglobin, n = 43) and non-anemic (>10.5g/dL hemoglobin, n = 52) from Tanzania and Mozambique at B0. Black squares indicate samples where RNA sequencing was performed on whole PBMC in addition to immunophenotyping. B) Hierarchical clustering of 376 differentially expressed (DE) genes between anemic (n=6) and non-anemic (n = 8) Tanzanian children. Significantly different genes had an fdr-adjusted p-value of <0.01 from DESeq2 and an fdr-adjusted p-value of <0.05 from the intensity-difference test, and were clustered using Euclidean distance. Each column represents an individual sample, and genes shown as rows. Enriched blood transcriptional modules (BMTs) in C) anemic and D) non-anemic children, represented as colored circles with annotations as text. Colors and connecting lines show gene-sets with related genes, and summary terms shown in text boxes. BTMs enriched from within all expressed genes (17,607) with an enrichment score greater than 1.5 or less and −0.5 and a fdr adjusted p-value of <0.01 (Kolmorogov-Smirnov test) are shown. E) The contribution of sample age, anemia status and sex to the cell type variance as determined from linear regression models. Representative cell subset frequencies that were significantly different between anemic and non-anemic children at F) B0 (non-anemic n=52, anemic n = 43) and G) B21 (non-anemic n=99, anemic n = 20), with p-value from Mann-Whitney test. (H-M) Purified B cells from UK adults were stained with CellTraceViolet and incubated in culture media with IL-21 and CD40L (CM) for five days. Some cultures were supplemented with either apo-transferrin (APO) throughout or with ciclopirox olamine (CPX) after 24 hours of culture. H) The percentage and number of live B cells at Day 0 and Day 5 in CM, APO and CPX culture conditions. I) Representative histogram of cell trace violet on day 5 (black = CM, red = APO, blue = CPX), and J) the percentage of cells that have undergone one or more divisions on day 5. K) Plasmablast gating strategy (Live IgD−CD27+CD38+IRF4+ B cells). L) The percentage of plasmablasts, and fold change (FC) relative to CM alone. M) The concentration of IgG in culture supernatants as measured by ELISA, and fold change relative to CM culture conditions. H-M) p-values determined using Holm-Sidak’s multiple comparison testing, except for fold change analyses for which a one-sample t-test was used. Representative of 3 independent experiments with 6-8 UK adult blood samples.