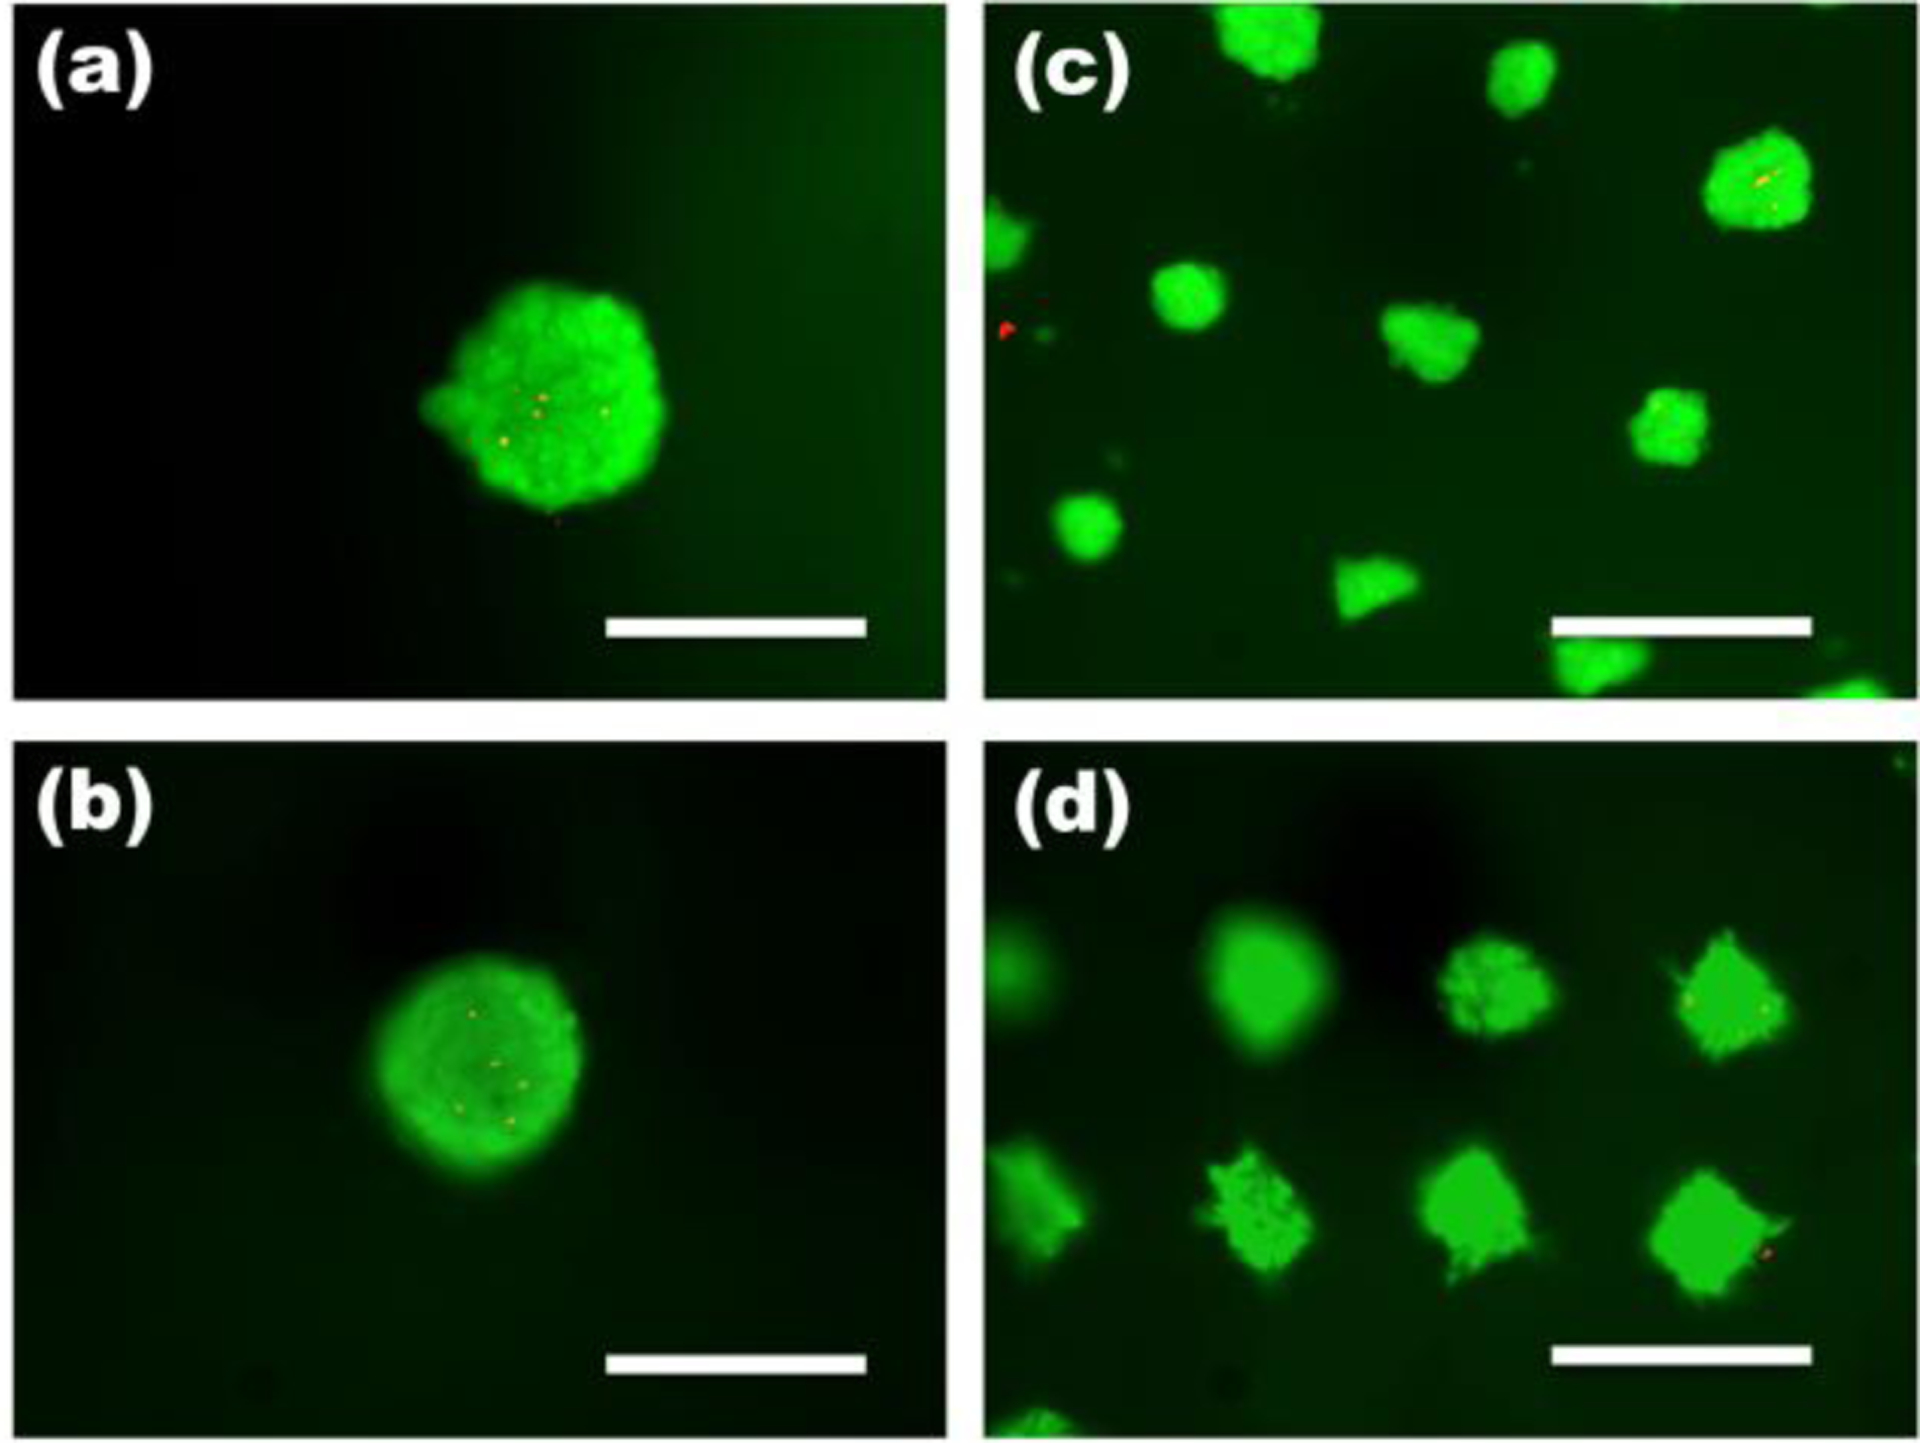
Figure 4. Viability of hASC spheroids.

Fluorescence photomicrographs of live (green) and dead (orange-red) cells in hASC spheroids in the dual crosslinked OMA/PEG microwell hydrogels formed with 500 μm grid patterns at (a) day 1and (b) day 4 and with 100 μm grid patterns at (c) day 1 and (d) day 4. The scale bars indicate 200 μm.
