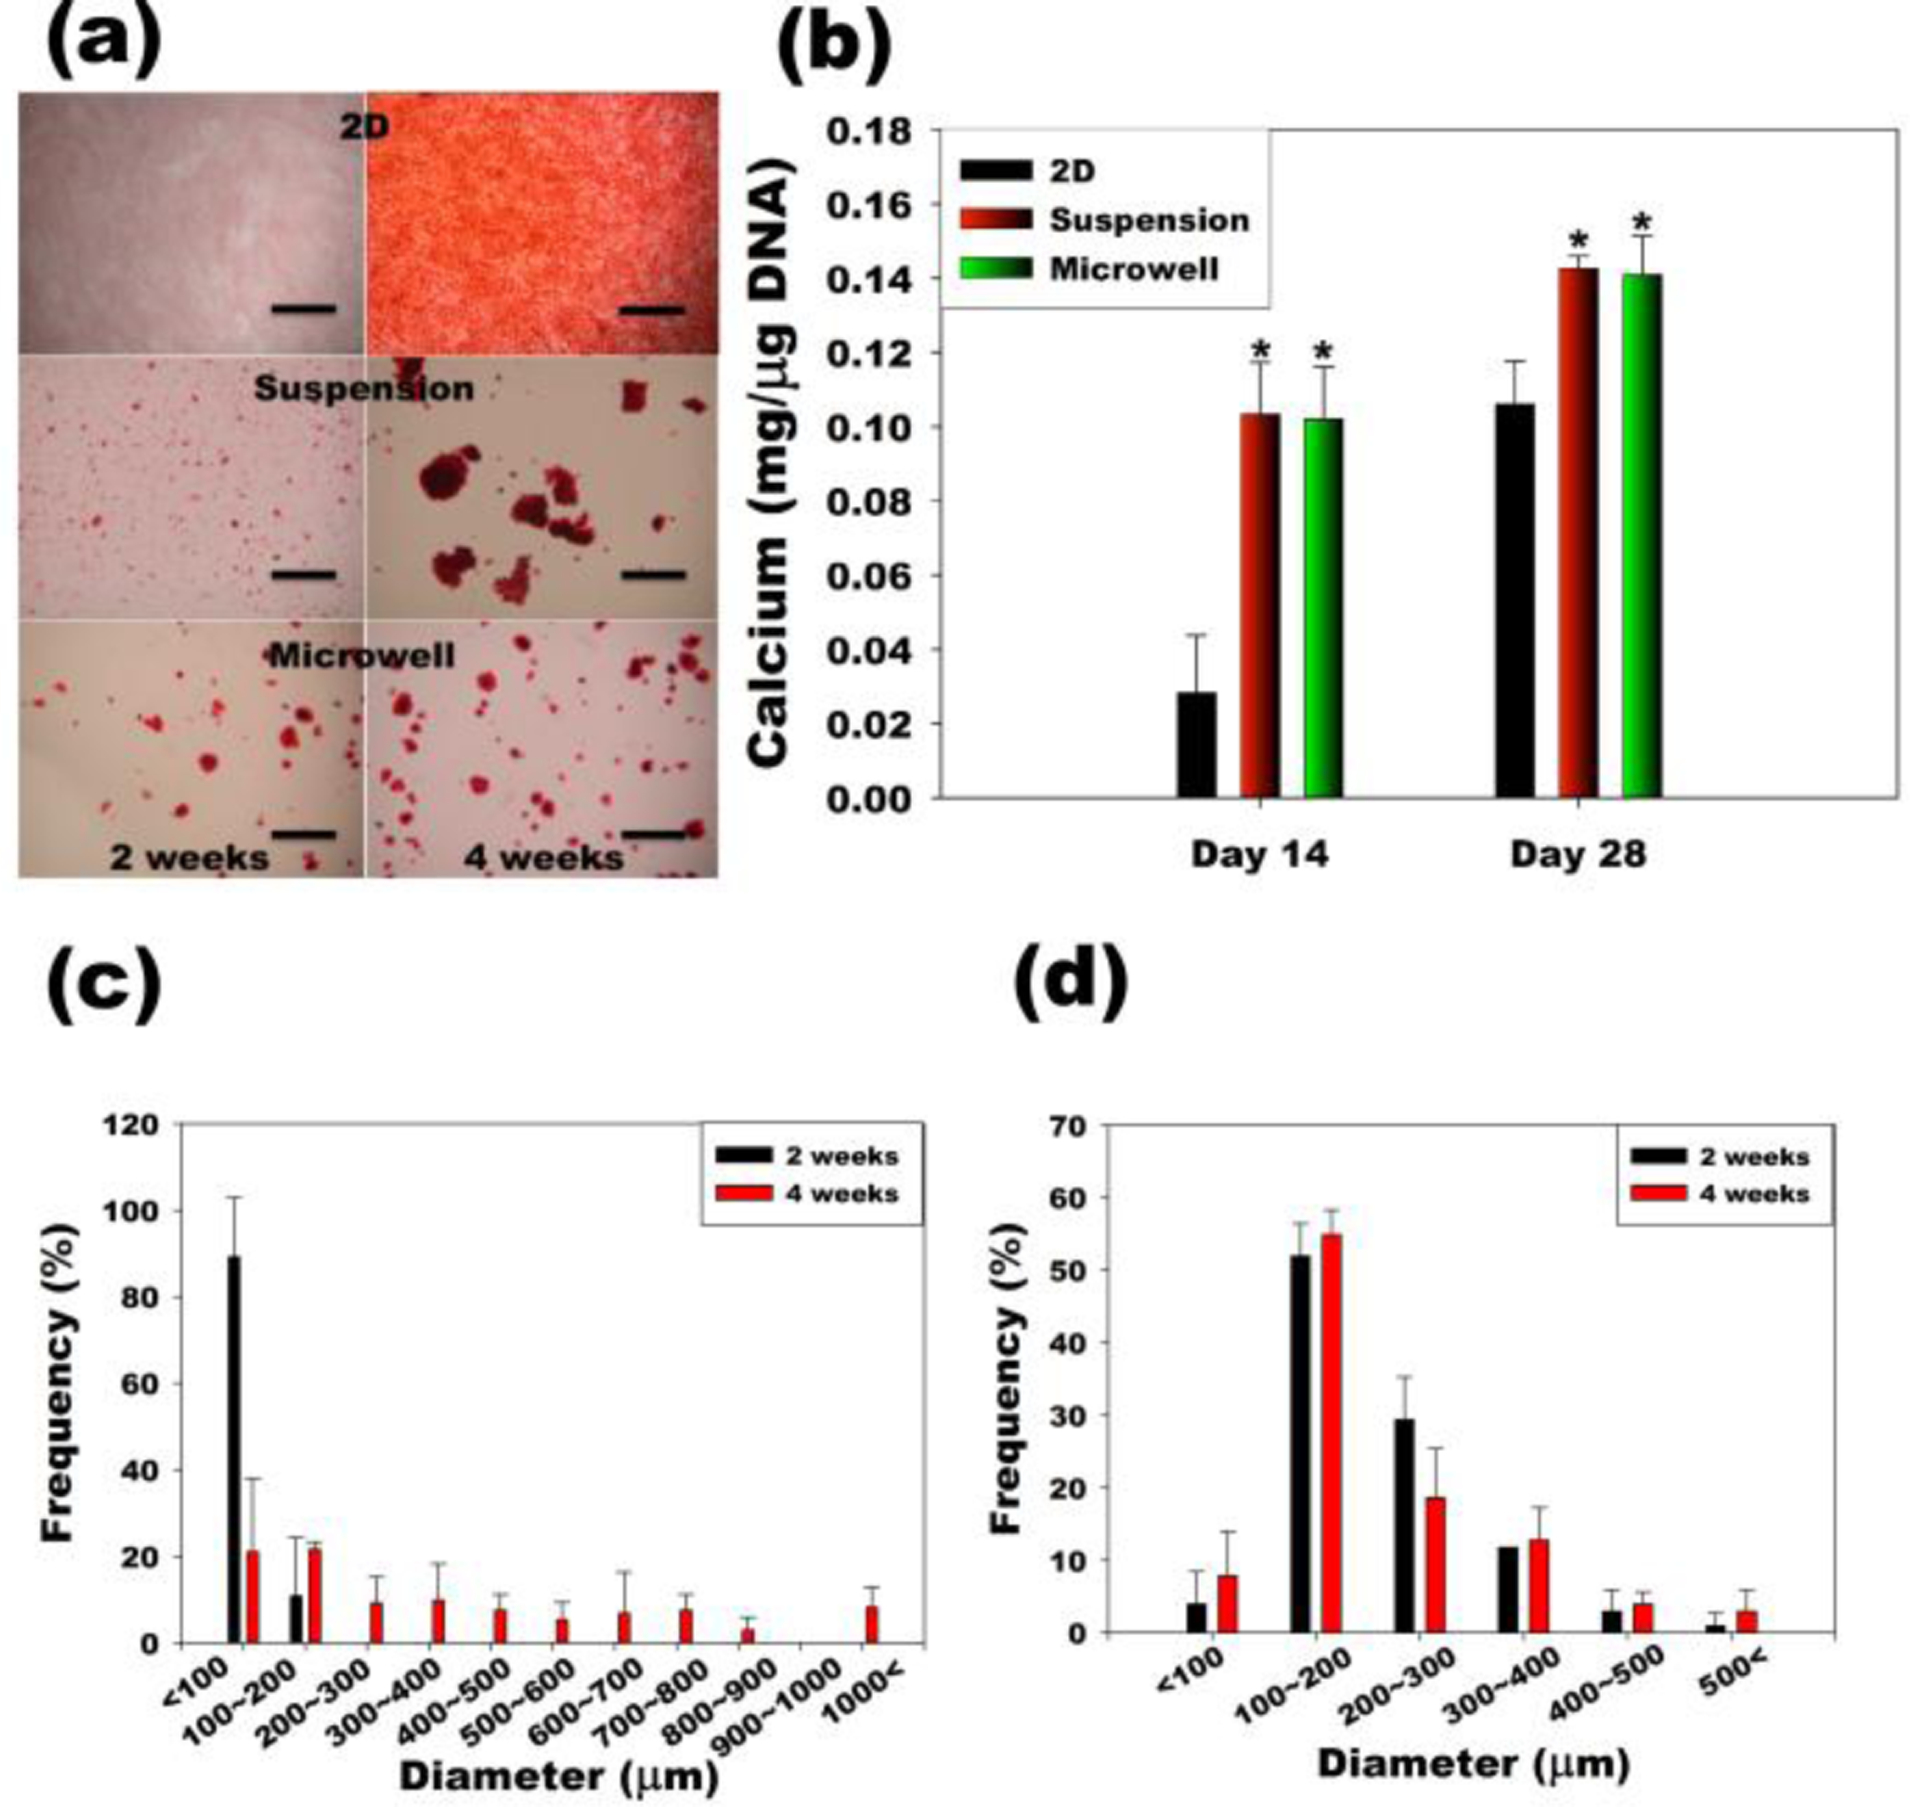
Figure 5. Osteogenic differentiation of hASC.

(a) Alizarin red S stained images of hASCs in traditional two-dimensional culture on tissue culture plastic (2D), conventional suspension culture in a spinner flask (Suspension), and suspension culture of spheroids in hydrogel microwells a spinner flask (Microwell). The scale bars indicate 2 mm. (b) Quantification of calcium content normalized to the DNA. *p<0.05 compared to 2D at specific time point. Size distribution of hASC multicellular spheroids in the (c) Suspension and (d) Microwell groups.
