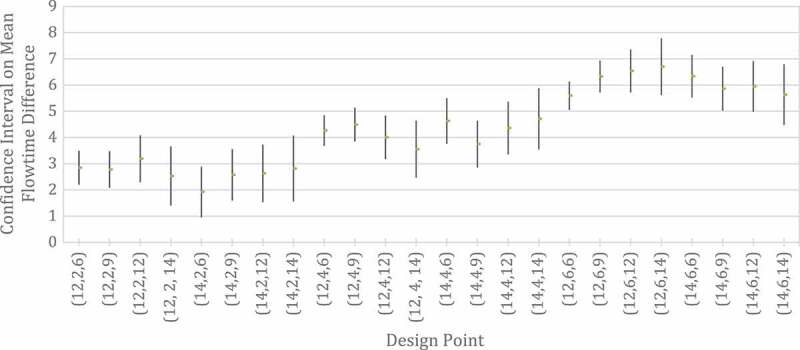
Figure 4.

Ninety-five per cent t-confidence intervals for the difference between the mean flow times of Scenario 2 and Scenario 1. The design point triplets are (average total time for Provider 1, average wrap-up times for Provider 1, average service times for Provider 2)
