Figure 2.
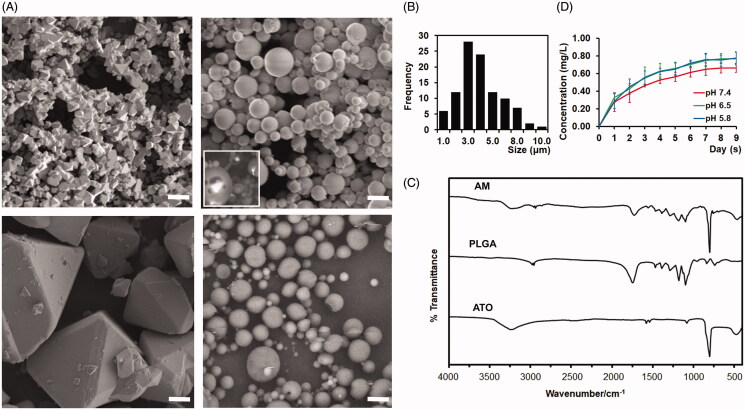
Developing and charactering arsenic trioxide (ATO) microcrystal-loaded microspheres (AM). (A). Representative electron microscope images of ATO microcrystal (left upper), AM (right upper), ATO large crystal (left lower), and vacant microsphere (right lower). Inset panel of right upper quadrant: Degrading AM to show the encapsulated ATO microcrystal. Bar = 5 μm. (B) Distribution of the size of AM. (C) Fourier-transform infrared spectroscopy (FT-IR) spectra of ATO, vacant PLGA microsphere, and AM. (D). Drug releasing curve of AM in PBS (pH = 5.8, 6.5, or 7.4) (data: mean ± SD).

