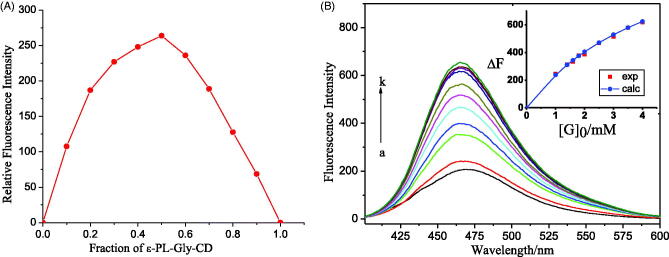
Figure 4.
(A) Job plot for the host:guest system at λem: 474 nm ([SCU] + [ε-PL-Gly-CD]/10 = 3.0 × 10⁻⁵ M) in pH 10.5 buffer, (B) Fluorescence emission spectra of SCU (3.0 × 10⁻⁵ mol/L) containing various concentrations of Gly-CD of ε-PL-Gly-CD (0-0.1 mM, from a to k); emission at 474 nm, and nonlinear least-squares curve-fitting analyses (insert) for the inclusion complexation.

