Figure 1.

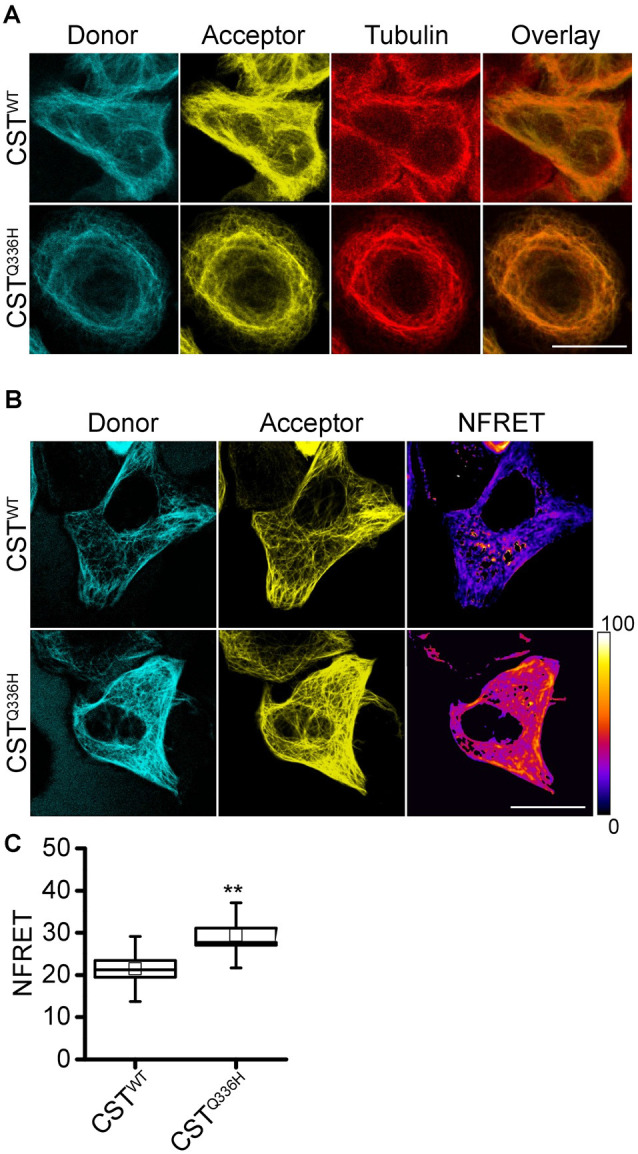
CSTQ336H conformation in live cells. (A) Imaging of HeLa cells expressing CSTWT or CSTQ336H and hybridized with anti-α-tubulin antibody; donor channel (blue), acceptor channel (yellow), and Tubulin (red). White scale bar = 10 μm. (B) NFRET images (false color), donor (Blue), acceptor (yellow) of reporter cells. White scale bar = 10 μm. (C) NFRET quantification of cells expressing CSTWT (n = 15), CSTQ336H (n = 21). Box spans the standard error of the mean, while whiskers indicate the standard deviation (t-Student’s test, **p < 0.01).
