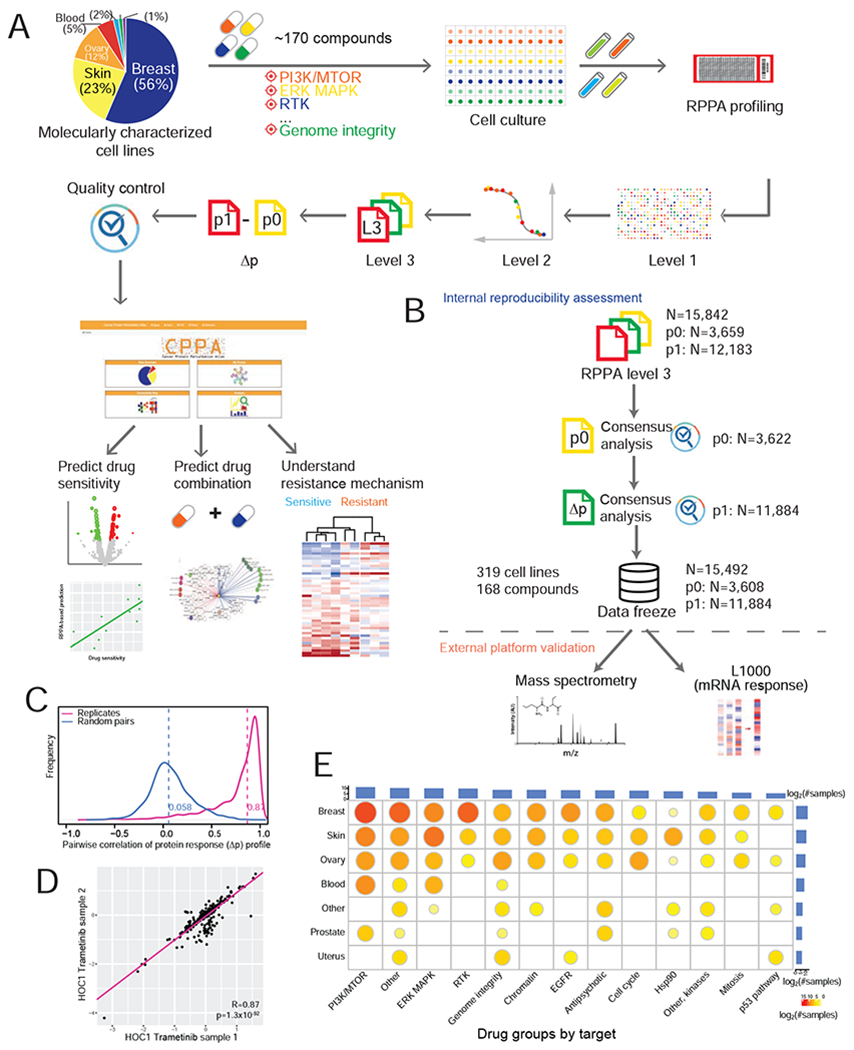
Figure 1. Summary of the perturbed RPPA profiling data in this study.

(A) Overview of the RPPA profiling experiments and data processing of cell line perturbations. The pie chart shows the lineage distribution of cancer cell lines profiled (n = 319). (B) The RPPA quality control pipeline, which contains within-platform assessment and external validation using independent platforms. (C) Reproducibility of perturbed RPPA data based on protein response (Δp) profiles of technical replicates (n = 2,753 pairs). (D) A representative scatter plot showing the correlation of Δp between two replicate samples across protein markers. (E) The distribution of drug-treated samples by cell lineages and drug groups. The bar plots show the numbers of samples profiled for each lineage or drug group, and the size of the circle is proportional to the number of samples profiled for each lineage-drug combination. See also Figure S1, Figure S6 and Table S1.
