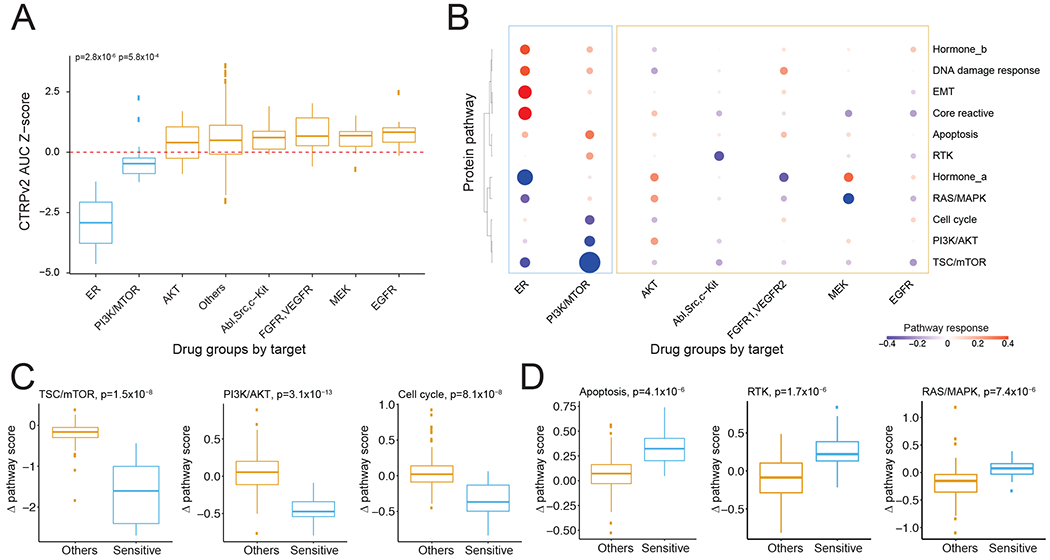
Figure 3. Protein responses to various drug treatments in MCF7 cells.

(A) A comparison of MCF7 drug sensitivity data between different drug groups using CTRPv2 data. (B) Heatmap showing the pathway responses among drug groups. The size of the circle is proportional to the effect size of the protein changes. (C, D) Boxplots showing significantly down- (C) and up-regulated pathways (D) in sensitive drug groups. The p-values were calculated by Student’s t-test. See also Figure S2.
