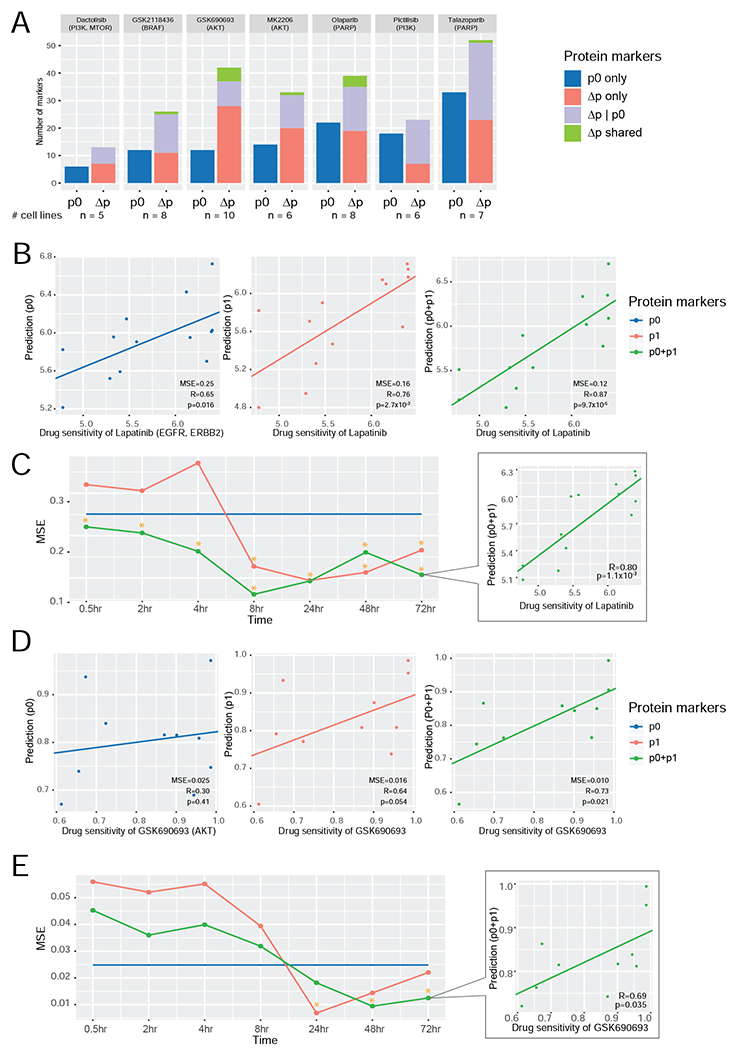
Figure 5. Comparison of the predictive power of protein markers for drug sensitivity.

(A) A summary of predictive markers based on baseline level (p0) and protein response (Δp) using drug response data from GDSC2. Given a specific drug, three types of predictive markers were identified: (i) proteins whose p0 level is significantly correlated with drug sensitivity; (ii) proteins whose Δp level is significantly correlated with drug sensitivity; and (iii) proteins whose Δp level is significantly correlated with drug sensitivity, given the p0 contribution. Protein markers identified based on both Δp only and Δp|p0 are called Δp shared. The number of cell lines for each compound is shown at the bottom. (B, D) The scatter plots showing the correlations between the predicted and measured drug sensitivity values of lapatinib (B) and GSK690693 (D) based on the multivariate models using three sets of protein markers, respectively (left, p0; middle, p1; and right, p0 + p1). Measured sensitivity data of lapatinib (n = 13 cell lines) and GSK690693 (n = 10 cell lines) were from Daemen et al. (2013) and GDSC2, respectively. (C, E) The MSE curves of the three predictive models at different time points for lapatinib (C) and GSK690693 (E). The time points with significant correlations between the predicted and measured values are indicated with *. The scatter plot at the last time point is shown.
