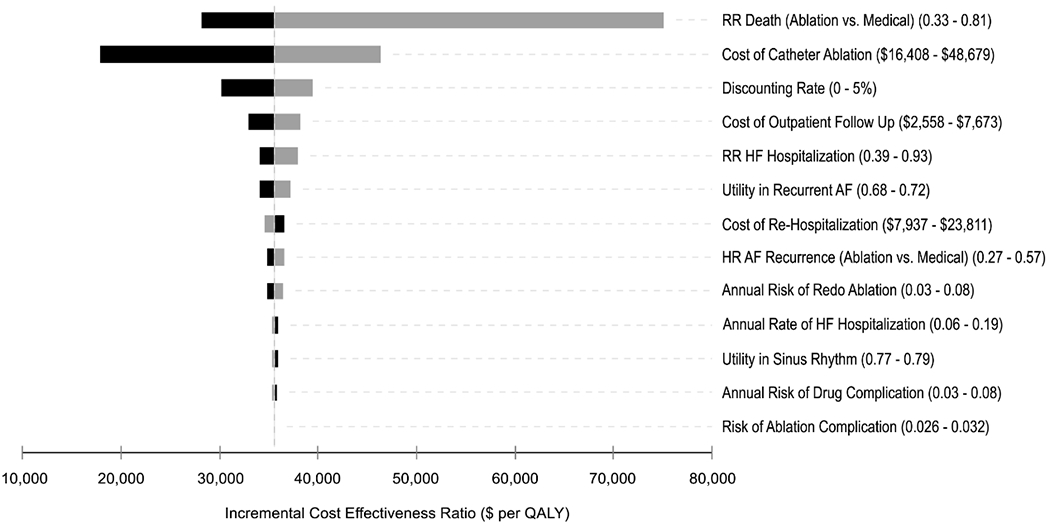
Figure 2.

Tornado diagram summarizing one-way sensitivity analyses on incremental cost-effectiveness ratio (cost per quality-adjusted life years gained). Grey and black bars denote the effects of the upper and lower bounds of each variable input, respectively. That is, the upper bound may have differential effects on the incremental cost-effectiveness ratio depending on the variable input. Abbreviations: AF, atrial fibrillation; HF, heart failure; QALY, quality-adjusted life year; RR, relative risk.
