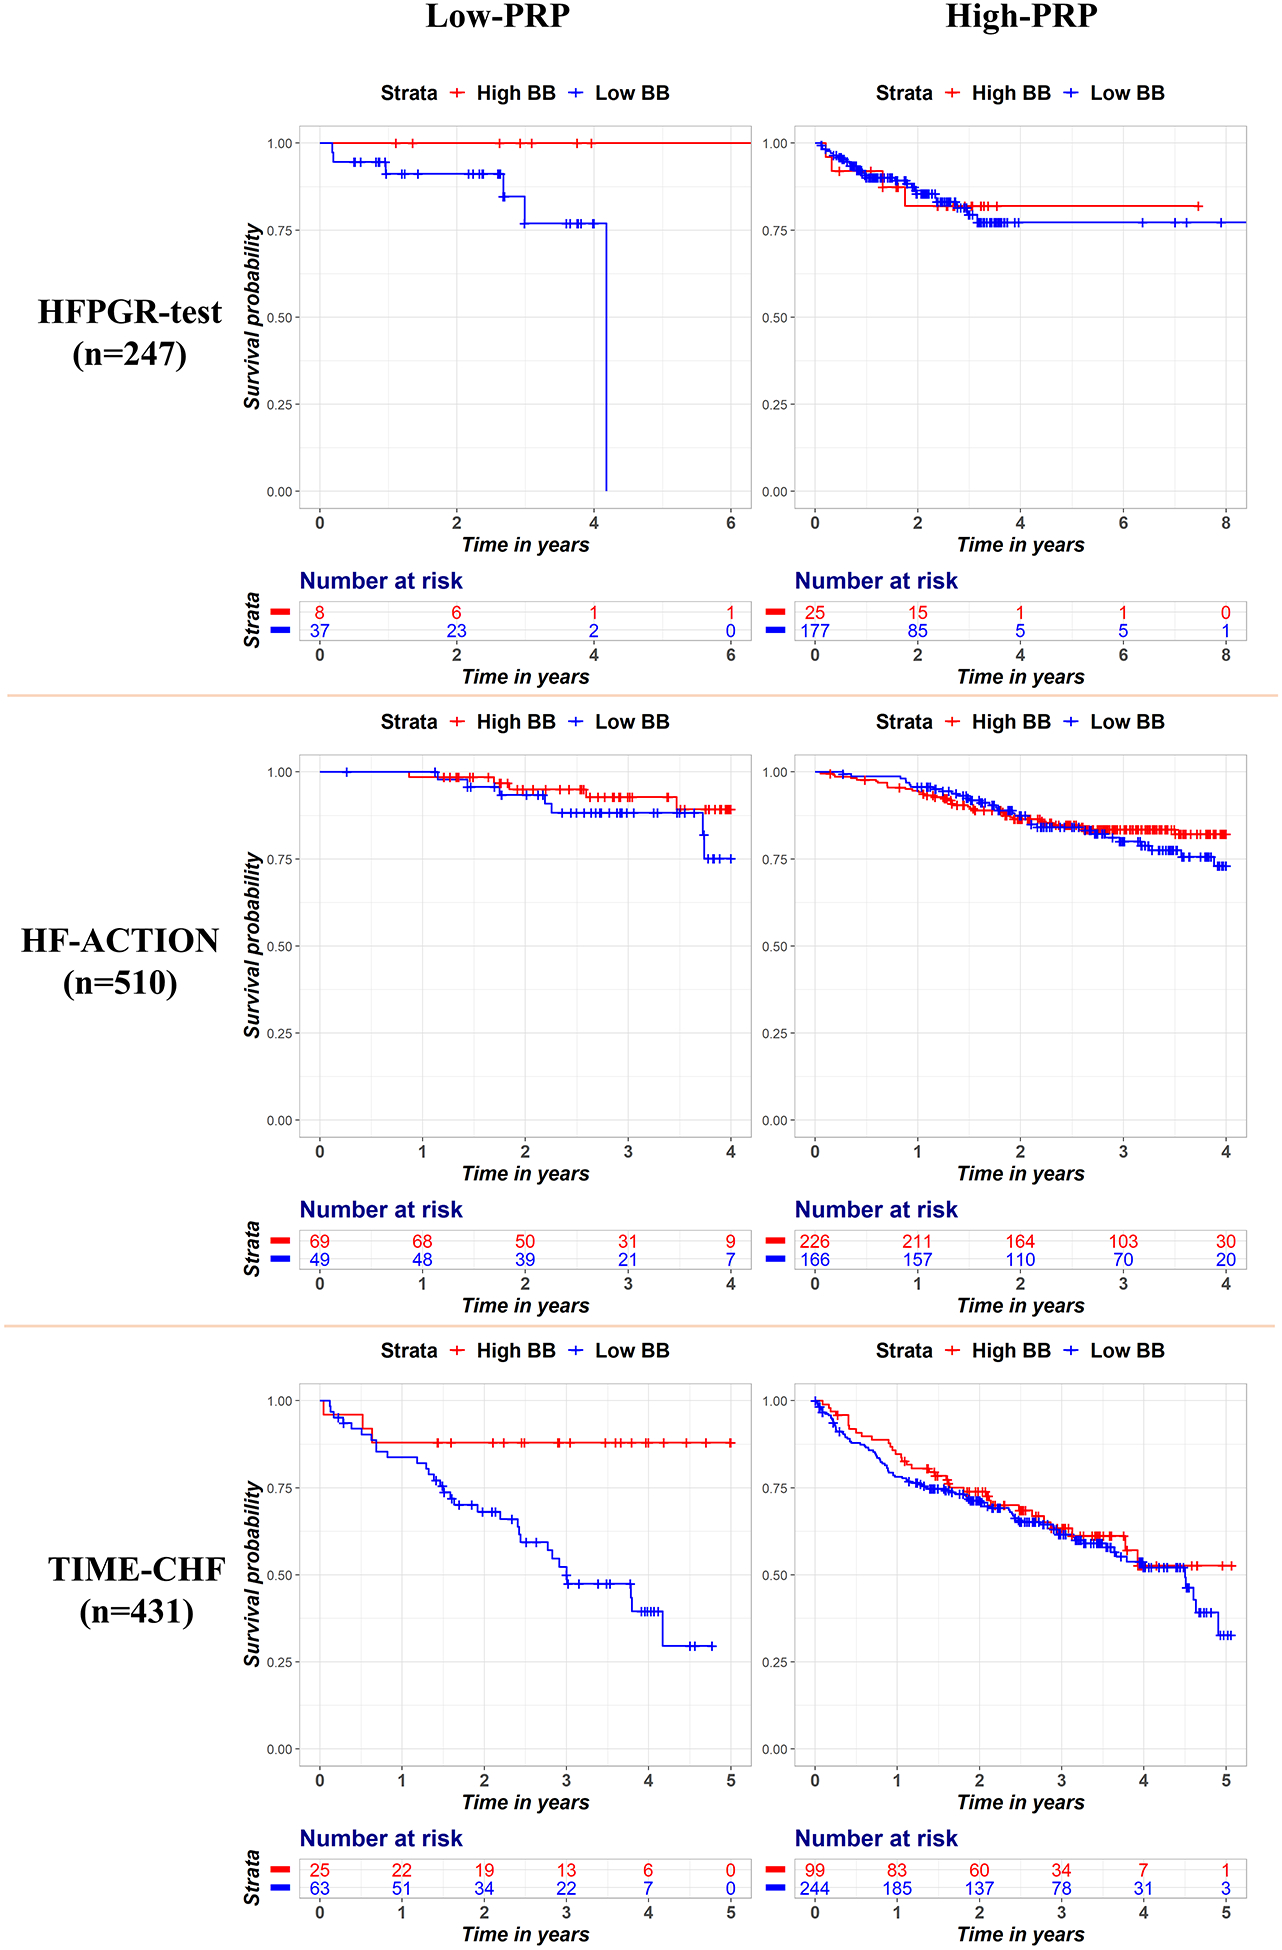
Figure 4.

Kaplan Meier survival curves stratified by PRP (high vs. low) and BB exposure for each dataset. The left panels show patients with a low PRP and the right-sided panels show patients with a high PRP. The red curves are patients with high BB exposure (≥50% target dose), and blue curves are patients with low BB exposure. BB = Beta Blocker; PRP = polygenic response predictor
