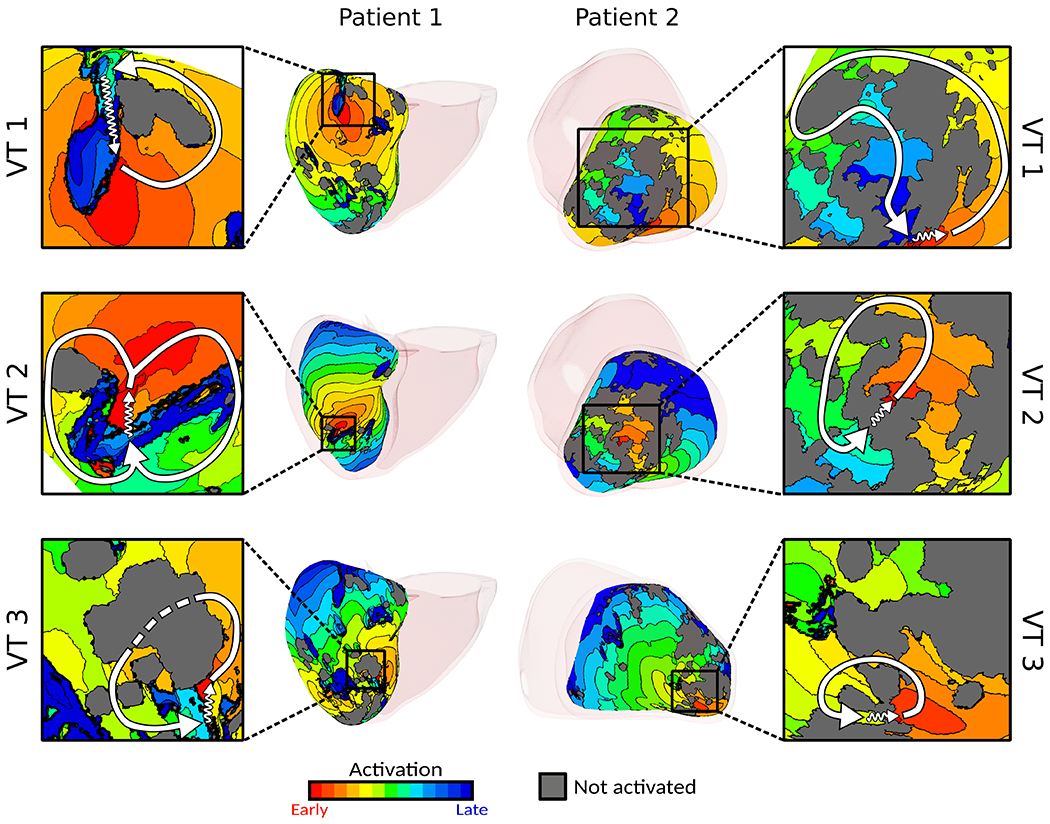
Figure 3:

Digital-heart simulations predict potential VTs. Examples of VTs in digital hearts of patients 1 and 2. Insets present detail of activation; white arrows denote re-entrant pathway, zigzag arrows denote conduction channels, and dashed line (patient 1 VT 3) denotes conduction below non-activated tissue. For patient 1, activation maps for VT 1 and VT 3 depict the epicardial surface whereas the activation map for VT2 depicts the endocardial activation map. For patient 2, all activation maps shown depict the endocardial surface. Abbreviations as in Fig.1.
