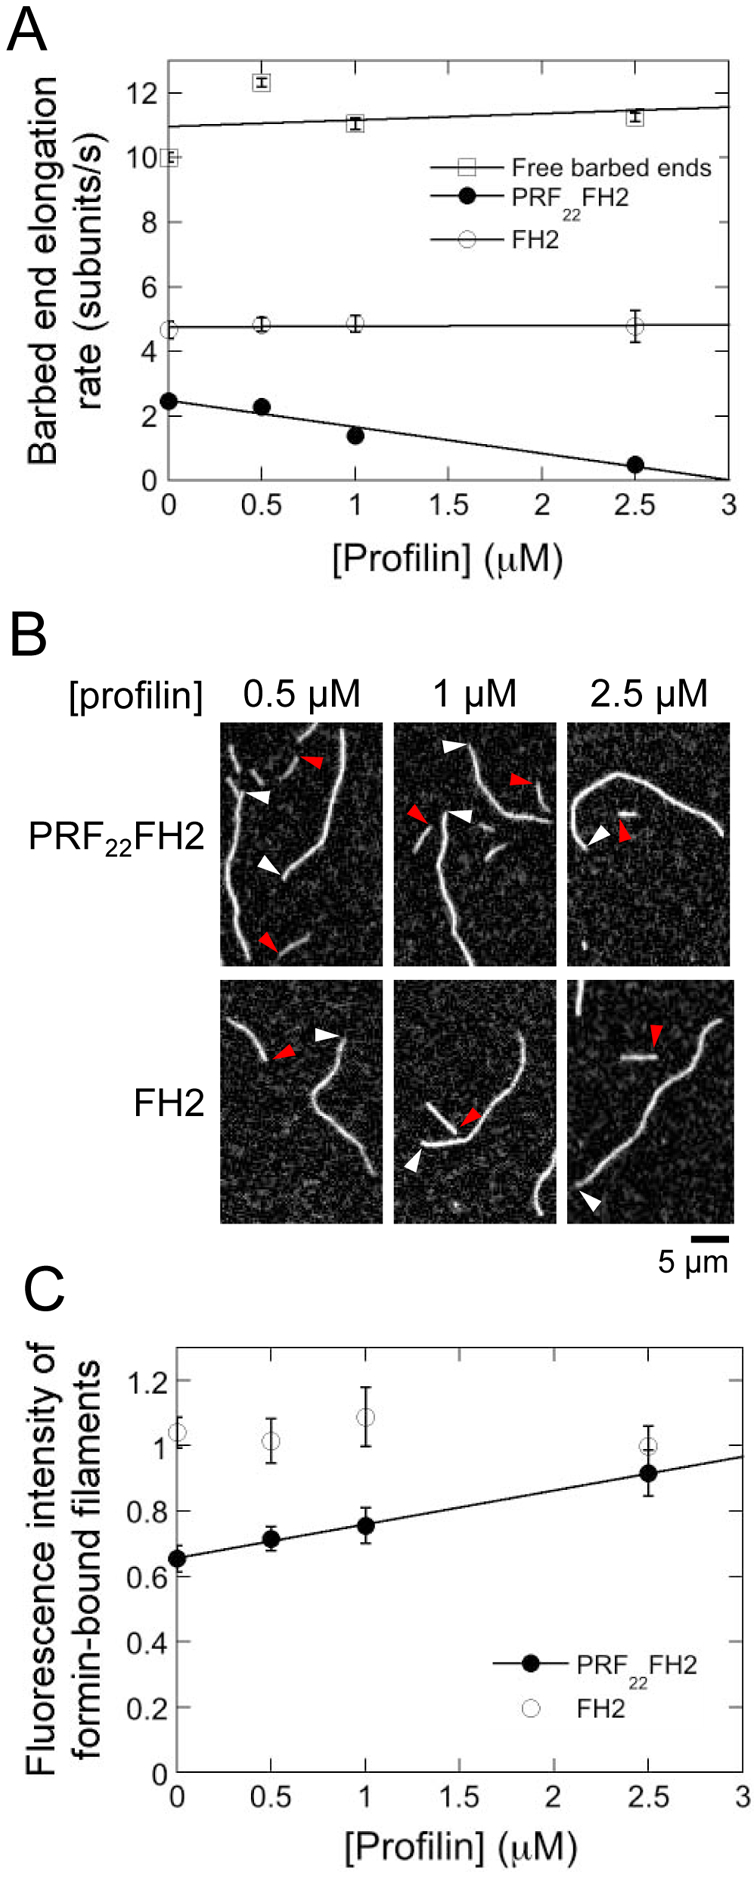
Figure 3. Free profilin attenuates actin delivery by FH1-tethered profilin.

The experimental conditions were as follows: 0.75 μM actin monomers (33% Oregon Green-labeled) were allowed to polymerize in the presence of a range of S. cerevisiae profilin in microscopy buffer. The data were collected by TIRF microscopy. (A) Dependence of the rates of elongation of barbed ends bound by Bni1p PRF22FH2 (filled circles) or Bni1p FH2 (open circles) on the concentration of S. cerevisiae profilin. Error bars are standard errors of the mean elongation rate of at least 15 filaments. Lines are linear fits to the data. (B) Representative TIRF micrographs of actin filaments elongating in the presence of Bni1p PRF22FH2 or Bni1p FH2 and a range of S. cerevisiae profilin concentrations. White and red arrowheads indicate the barbed ends of free and formin-bound actin filaments, respectively. (C) Dependence of the fluorescence intensities of actin filaments bound by Bni1p PRF22FH2 and Bni1p FH2 on the concentration of S. cerevisiae profilin. Fluorescence intensities of formin-bound filaments were normalized to the intensities of filaments that are not formin-bound. Error bars are standard errors of the mean intensities of at least 15 filaments. Line is a linear fit to the data for Bni1p PRF22FH2.
