
Fig. 1.
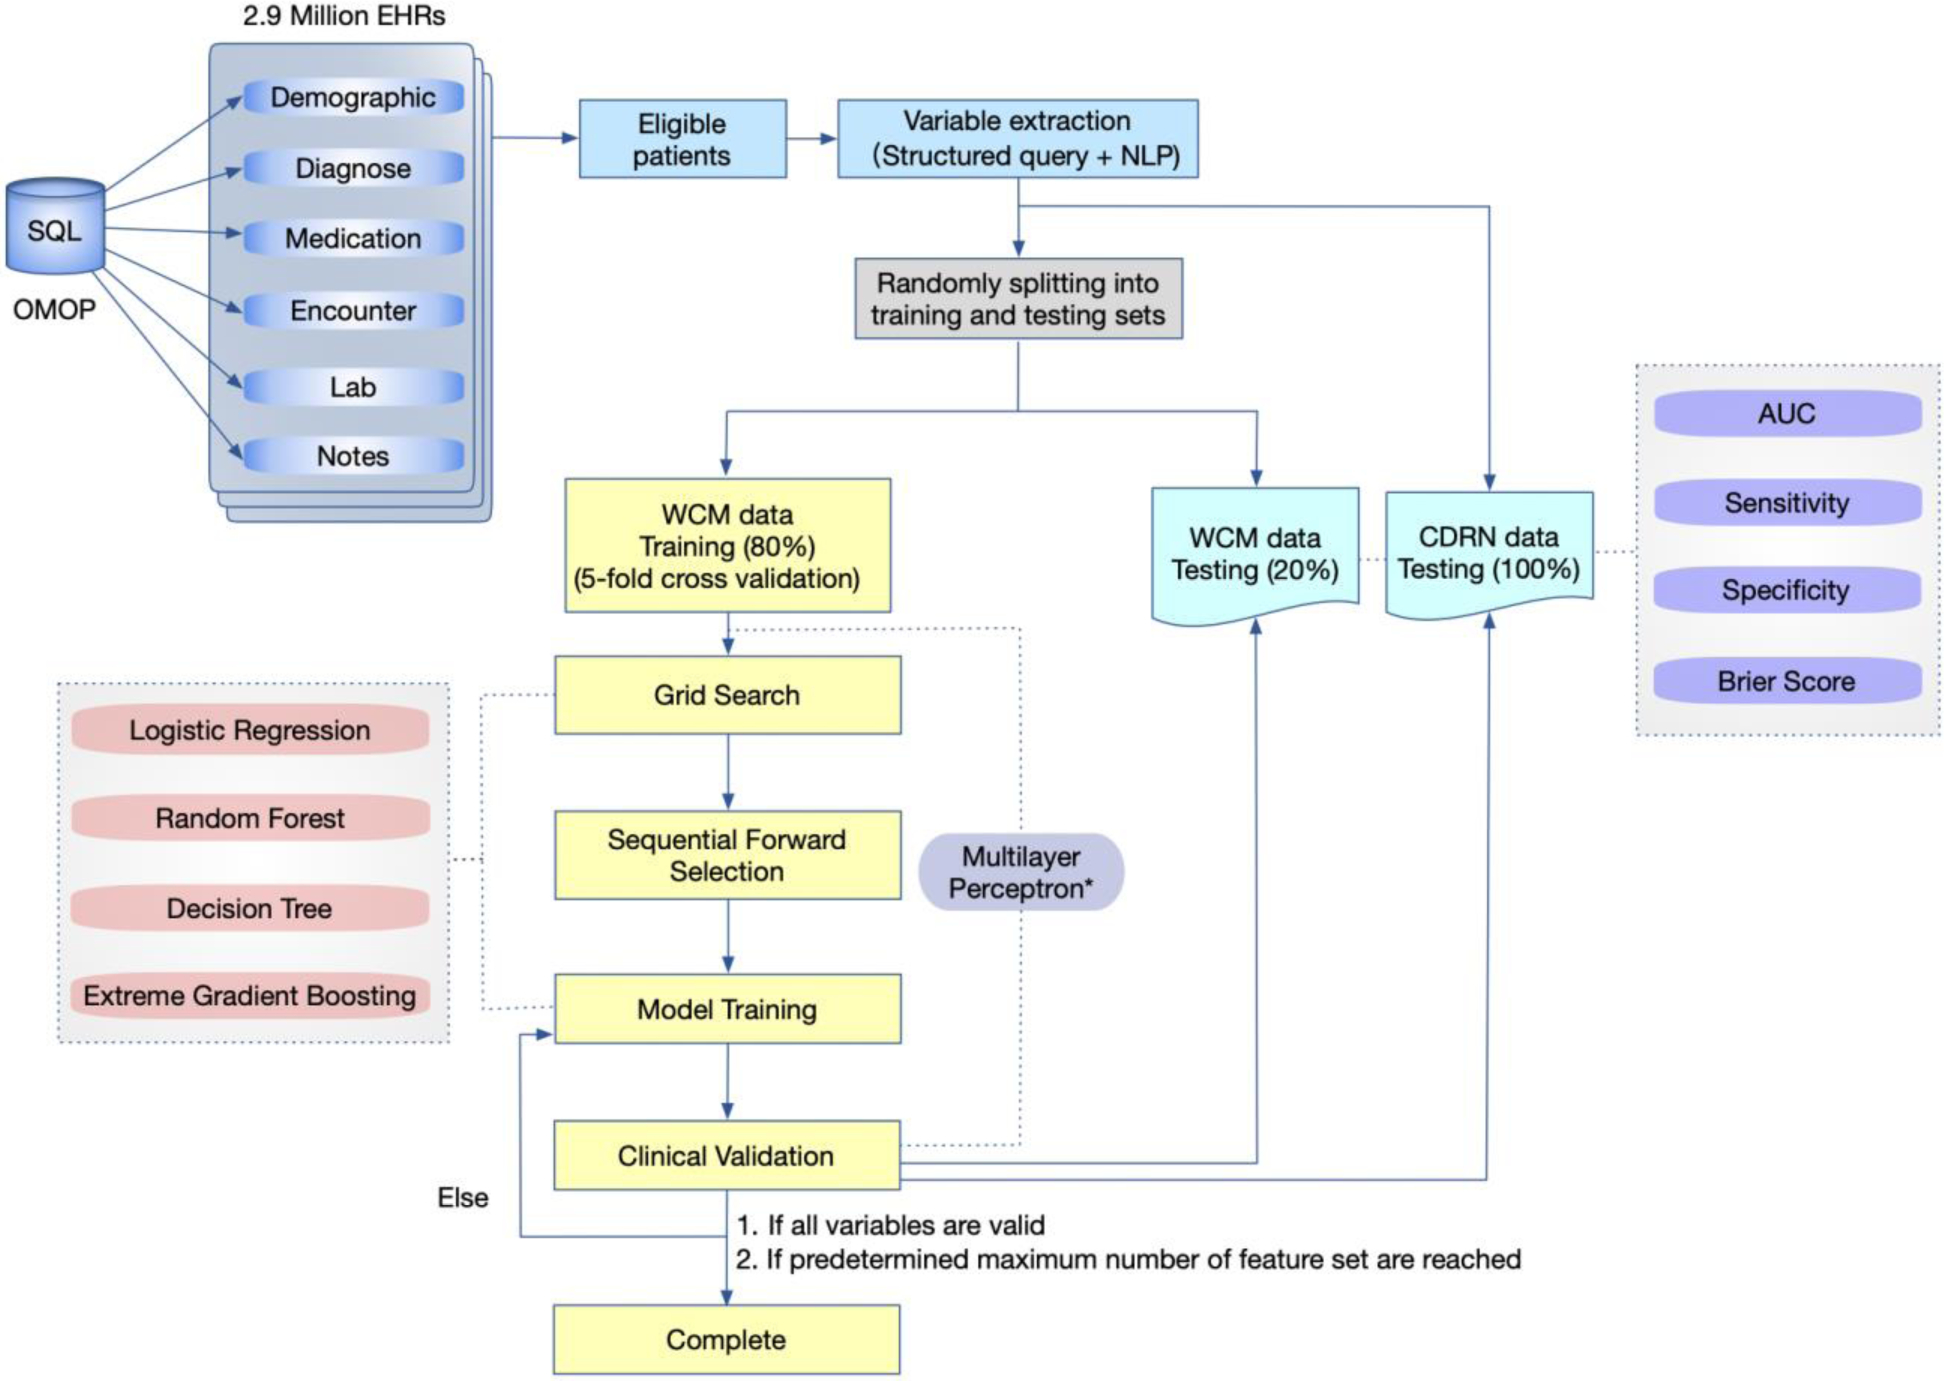
Schematic diagram of our PPD prediction framework. This diagram depicts the process of the study. The modified version of multilayer perceptron (gray) is used to compare with Tortajada et al (2009).
Official websites use .gov
A
.gov website belongs to an official
government organization in the United States.
Secure .gov websites use HTTPS
A lock (
) or https:// means you've safely
connected to the .gov website. Share sensitive
information only on official, secure websites.
Schematic diagram of our PPD prediction framework. This diagram depicts the process of the study. The modified version of multilayer perceptron (gray) is used to compare with Tortajada et al (2009).