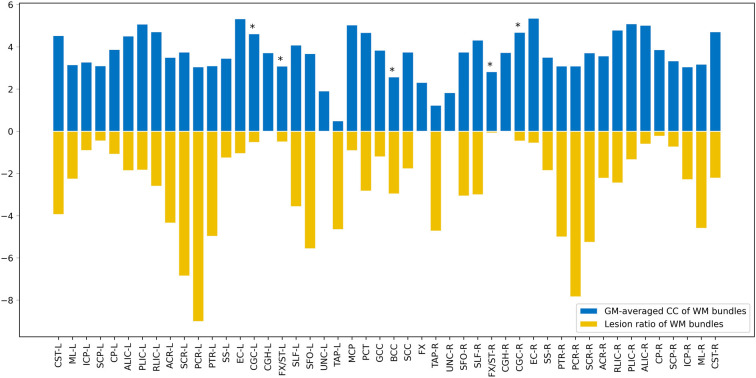
Figure 5.
Map showing the comparison of WM bundle function and lesion ratio. The X axis depicts the 48 WM bundles, the positive longitudinal coordinate is the WM function of these bundles, and the negative longitudinal coordinate is the lesion ratio of the corresponding bundles. *P < (1/48) = 0.021.

