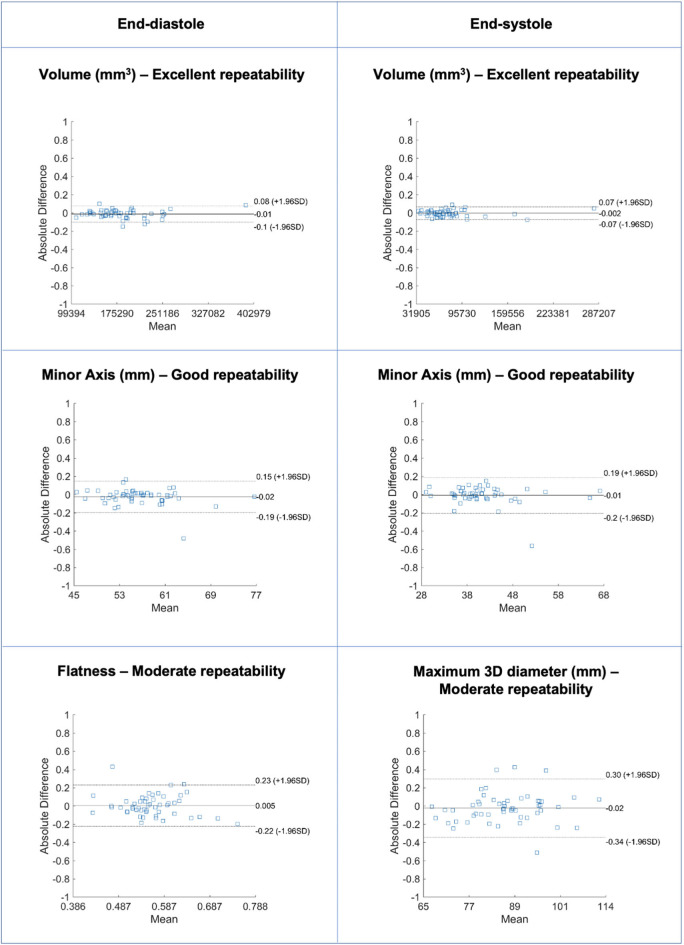
Figure 2.
Bland-Altman plots for selected LV blood pool shape features in end-diastole (left) and end-systole (right) with different levels of repeatability. Differences in Bland-Altman are calculated after normalizing radiomics in the range [0–1] to facilitate comparison among different features. All features are unitless. LV: left ventricle.

