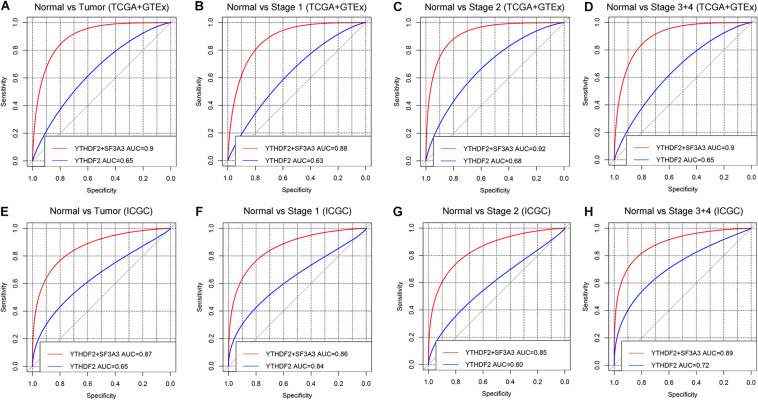
FIGURE 8.
Diagnostic value of high expression of YTH domain family (YTHDF) 2 and SF3A3 in liver hepatocellular carcinoma (LIHC). (A,E) Receiver operating characteristic (ROC) curve for expression of YTHDF2 and SF3A3 in normal tissue and tumor tissue. (B–D,F–H) Subgroup analyses for ROC curves for stages I, II, and III + IV.

