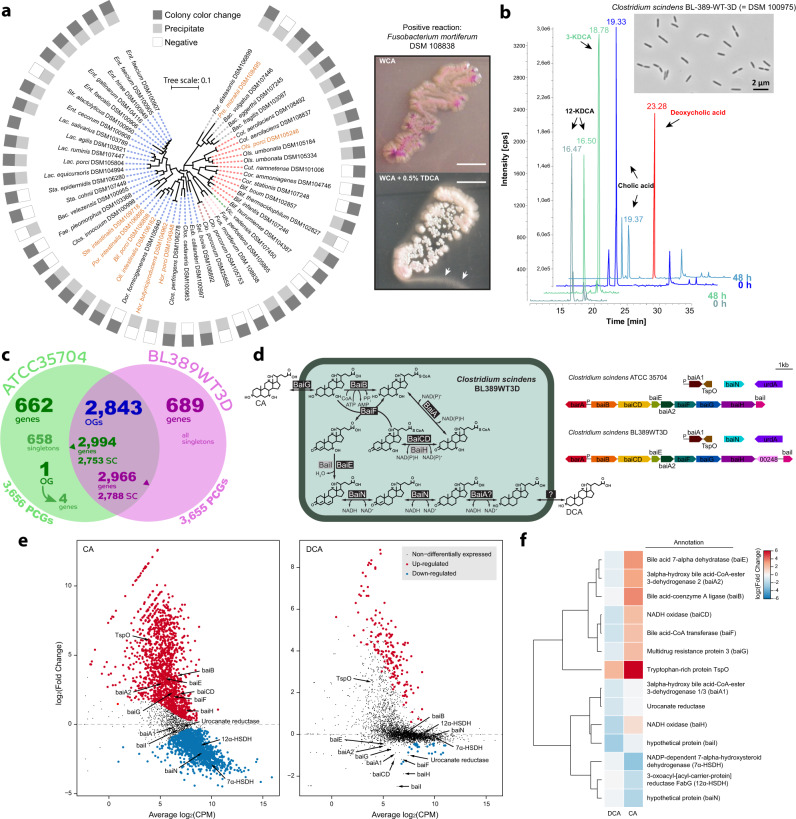
Fig. 6. Bile acids metabolism capacities and functional host-specific traits.
a Left: 16S rRNA gene-based phylogenetic tree showing the diversity of isolates able to deconjugate bile acids. Species (corresponding branches) are coloured according to phyla as in Fig. 1. Right: magnified pictures of a culture of Fusobacterium mortiferum grown on plates (WCA, Wilkins–Chalgren-Anaerobe medium) without (top) or with (bottom) addition of 0.5% (w/v) tauro-conjugated deoxycholic acid (TDCA). Two criteria were considered as indicative for positive reaction: (i) whitening of the colonies; (ii) formation of a halo surrounding colonies (solid medium; white arrows in the picture) or precipitates visible at the bottom of the wells and jellification of the medium when grown as liquid cultures (not shown). The scale bars represent 5 mm. b Chromatograms showing the conversion of cholic acid to deoxycholic acid by C. scindens DSM 100975. KDCA, ketodeoxycholci acid. The two chromatograms on top span the entire run time. The bottom ones are zoom-in sections (XIC:+MRM m/z 424.367/371.300 Da) until the indicated time to visualize the appearance of 3-KDCA. c Venn diagram of comparative genomic analysis between the human faecal isolate C. scindens ATCC 35704 and the pig isolate DSM 100975 (=BL-389-WT-3D). SC single-copy, PCG protein-coding genes, OG orthologous group. d Gene organization of the bile acid-inducible (bai) genes in the two strains and overview of the bile acid 7-alpha-dehydroxylation biochemical pathway. e Scatterplots of average log2(CPM) vs. log2(fold-change) from duplicate 0.1 mM cholic acid (CA) or deoxycholic acid (DCA) induced cultures of C. scindens DSM 100975. Genes involved in bile acid metabolism are labelled. f Heat map of bile acid-metabolizing genes from CA- and DCA-induced transcriptomes. Genes included in e and f were differentially expressed (+/−) 0.58 log2(FC) with false discovery rate (FDR) < 0.05.

