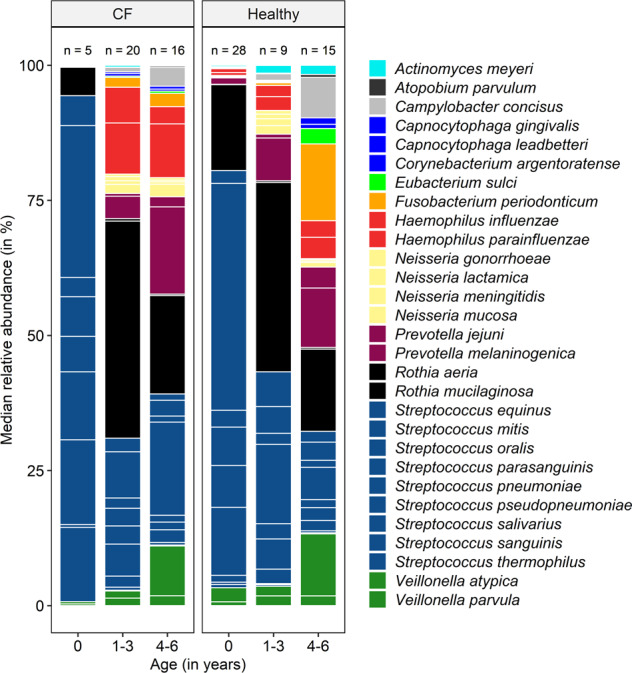
Fig. 1. Stacked barplot of median relative abundance (in %) across age groups in healthy and CF children.

Relative abundance was calculated from bacterial to human cell ratios. The bars and legend are sorted alphabetically. The colours represent taxonomic classification at genus level. The white lines, which are separating blocks of the same colour depict median relative abundances of species. The order of species per colour bar is alphabetic. The numerical data and statistically significant differences based on species levels are listed in Supplementary Table 2. The total number of children (n) in each group is stated on top of the bar.
