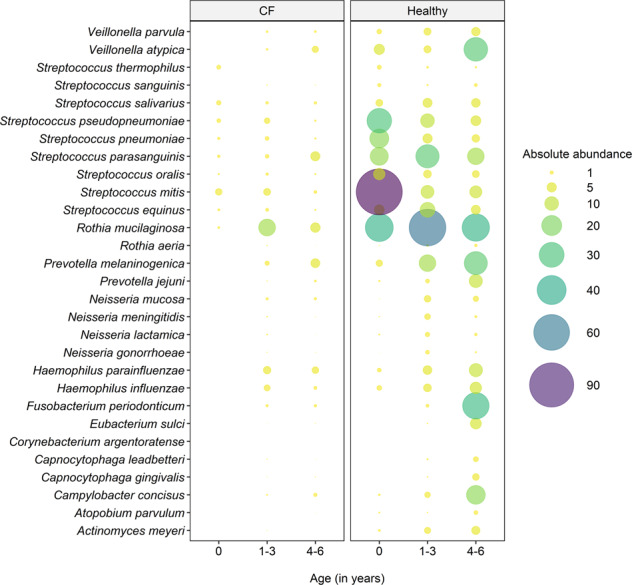
Fig. 2. Bubble plot of the median absolute abundance of core species in the respiratory tract of CF children (left) and healthy children (right) across age groups.

CF children display lower absolute abundances of all core species in the respiratory tract compared to healthy controls across all age groups. The absolute abundance was calculated as described by Losada et al.19, where the length of the diploid human genome is divided by a million to account for the bacterial count scale. The quotient is multiplied by the normalised bacterial read count (normalised to a million reference base pairs) and the final product is divided by the human read count. The statistically significant differences in absolute abundances are confirmed in Supplementary Fig. 2. In the CF cohort, there were 5 infants below the age of one, 20 between 1 and 3 years of age and 16 children between 4 and 6 years of age. In the healthy cohort, there were 28 infants below the age of one, 9 children between 1 and 3 years of age and 15 preschool children were 4 and 6 years of age.
