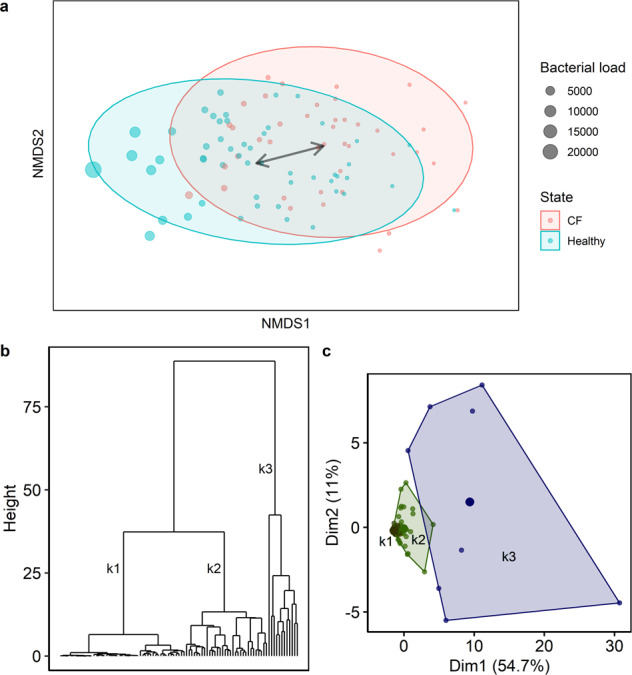
Fig. 3. Clustering analyses to identify known and unknown patterns, which influence microbial community profiles in children.

a Non-metric multidimensional scaling based on Bray–Curtis dissimilarity matrices identified massive overlap between healthy and CF microbial community profiles. The bacterial load (absolute abundance) indicates the number of bacterial cells per human cell. b Hierarchical clustering (Ward’s clustering algorithm) based on Euclidean distances revealed three main groups of microbial community profiles in children between 0 and 6 years of age. c The group pattern was confirmed by principal component analysis (PCA). The PCA plot contains the first and second principal components as x- and y-axis, respectively. All core species contribute equally to the variance observed in the PCA, for example Streptococcus oralis explains 4.8% of the variance, R. mucilaginosa 4.7%, V. parvula 4.7%, Streptococcus parasanguinis 4.7%, Fusobacterium periodonticum 4.6% and so on (Supplementary Table 3).
