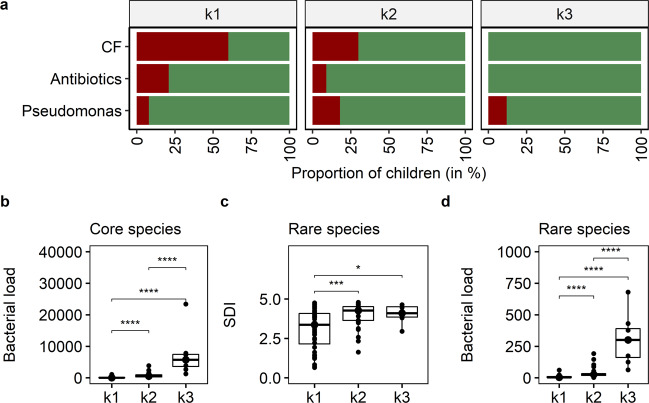
Fig. 4. Cluster characteristics based on clinical and microbial community data.
a Proportion of children in each cluster who were diagnosed with CF (red), considered as P. aeruginosa-DNA positive (red), received antibiotics in the month of sampling (red) and those who did not (green). b Bacterial load of core species in terms of bacterial cells per human cell (Kruskal–Wallis p value < 0.0001, e2 = 0.60, CI = 0.45–0.72). c Shannon diversity indices (SDI) of rare species (Kruskal–Wallis p value = 0.0005, e2 = 0.17, CI = 0.05–0.34) and d bacterial load of rare species across the three cluster groups (Kruskal–Wallis p value < 0.0001, e2 = 0.55, CI = 0.39–0.69). Pairwise comparison was done using the Conover–Iman test and Benjamini–Hochberg adjustment (pairwise p values are given in the diagram with *p < 0.05, **p < 0.01, ***p < 0.001, ****p < 0.0001). The centre line of the boxplot depicts the median (50th percentile). The lower and upper boundary of the box represent the first (25th percentile) and third (75th percentile) quartile, and hence define the interquartile range (IQR). Whiskers extend from the box to the largest/smallest non-outlier data point (1.5 × IQR).

