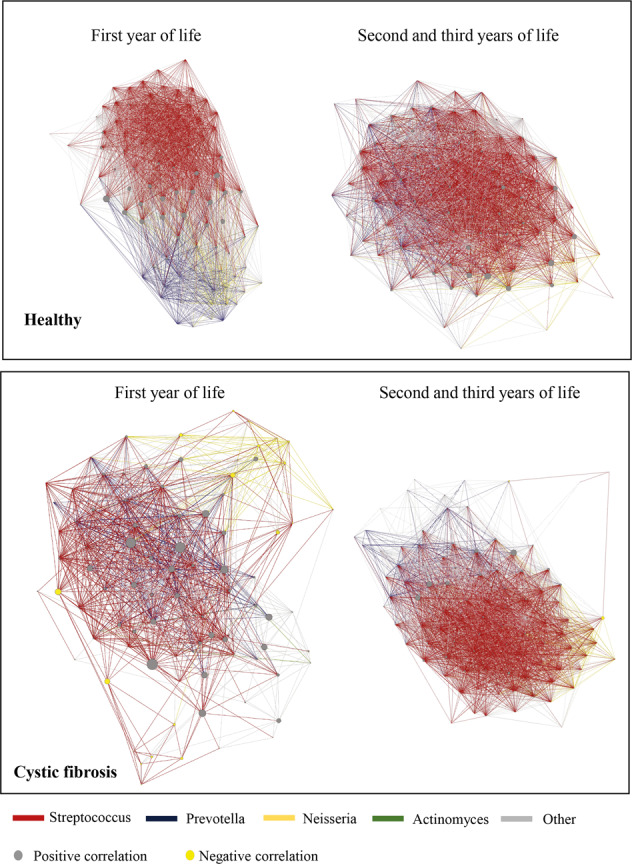
Fig. 5. Ecological network analysis of species Spearman’s correlation matrices in healthy and diseased infants.

The ForceAtlas algorithm was applied to Spearman’s rank correlation matrices, which were calculated from absolute species abundance tables of shotgun metagenomic sequencing data. Directed networks were generated by including only significant and strong positive correlations (p < 0.05, Spearman’s rank correlation coefficient > 0.60) and all significant negative correlations (p < 0.05), which are represented by grey and yellow nodes, respectively. Coloured edges visualise correlations that involve one of the four genera that explain most of the correlations (Streptococcus, Veillonella, Actinomyces and Neisseria), whereas all other edges are shown in grey. The size of network nodes refers to the corresponding betweenness centrality.
