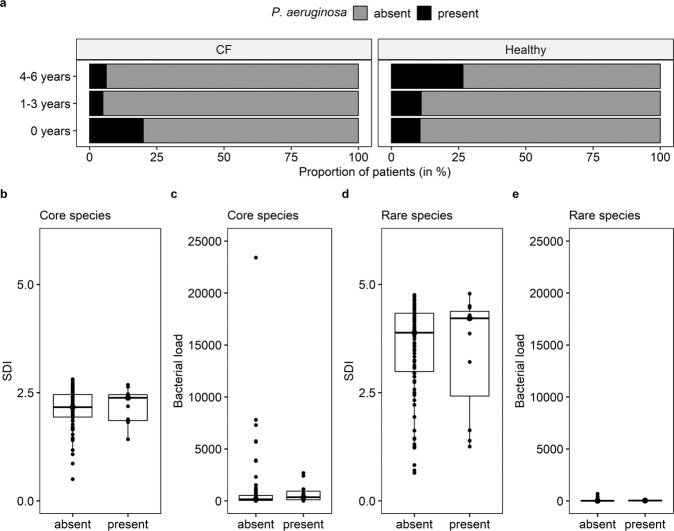
Fig. 6. Impact of P. aeruginosa-DNA detection on the respiratory tract metagenome of CF and healthy infants.
a Proportion of P. aeruginosa-DNA-positive and P. aeruginosa-DNA-negative children per age group and disease state. In the CF cohort, there were 5 infants below the age of 1, 20 between 1 and 3 years of age and 16 children between 4 and 6 years of age. In the healthy cohort, there were 28 infants below the age of 1, 9 children between 1 and 3 years of age and 15 preschool children were 4 and 6 years of age. b–e Shannon diversity indices (SDI) (b, d) and bacterial load of core (c) and rare species (e) based on the presence (right) and absence (left) of P. aeruginosa-DNA in cough swabs. The Mann–Whitney U test was applied to calculate significant differences between the two groups. No statistical differences were observed (p > 0.05). The centre line of the boxplot depicts the median (50th percentile). The lower and upper boundary of the box represent the first (25th percentile) and third (75th percentile) quartile, and hence define the interquartile range (IQR). Whiskers extend from the box to the largest/smallest non-outlier data point (1.5 × IQR).

