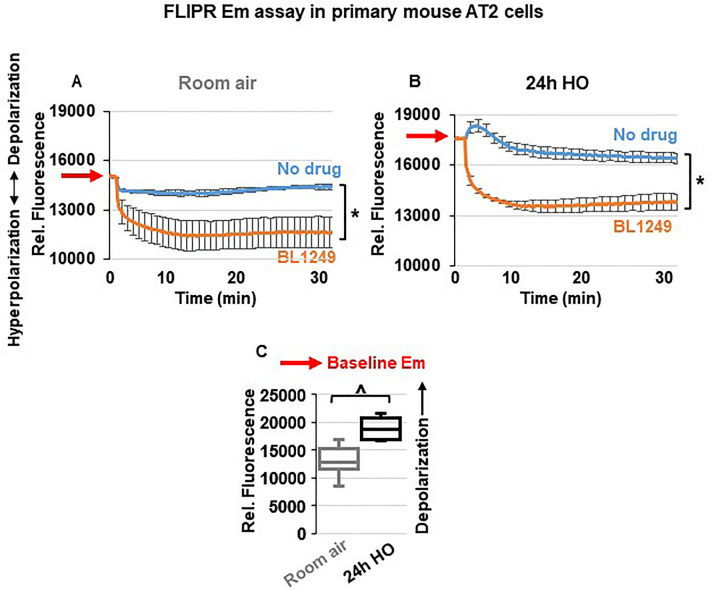
Figure 6.
TREK-1 activation causes plasma membrane potential (Em) hyperpolarization: Representative curves of Em-sensitive FLIPR assays showing that TREK-1 activation with BL1249 causes Em hyperpolarization in primary mouse AT2 cells under both room air and HO conditions (A,B), as indicated by a decrease in fluorescence values. Red arrows on the Y-axis indicate relative fluorescence values reflective of the baseline Em value in room air and HO exposed AT2 cells, demonstrating that HO exposure itself causes Em depolarization (higher baseline fluorescence value in B than A; *BL1249 compared to no drug/vehicle control, p ≤ 0.05). (C) Summary of baseline Em values of RA- vs. HO-exposed AT2 cells averaging n = 6 independent experiments for each condition. Data are represented as Box-Whisker plots with medians, 1st and 3rd quartiles, and max and min values; ^compared to room air exposed AT2 cells; p ≤ 0.05, individual experiments were run in triplicates.

