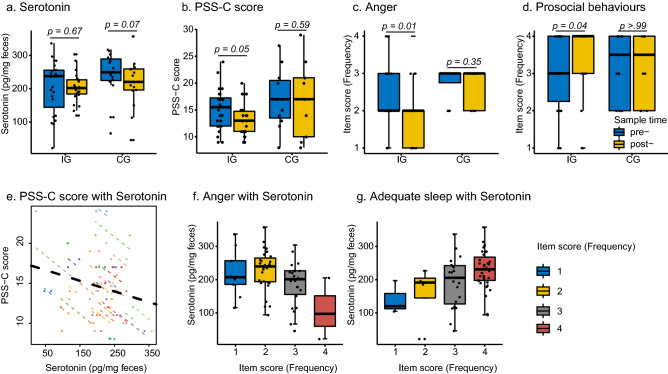
Figure 2.
Change in serotonin and child psychosocial measurements. (a) Change in fecal serotonin between IG (n = 23) and CG (n = 15), pre- and post-intervention. (b) Change in PSS-C score in child psychosocial measurements between IG (n = 20) and CG (n = 9). (c) Change in score of anger in child psychosocial measurements between IG (n = 24) and CG (n = 12). (d) Change in score of prosocial in child psychosocial measurements between IG (n = 24) and CG (n = 12). (e) Association between serotonin and PSS-C score. (f) Association between serotonin and anger frequency. (g) Association between serotonin and adequate sleep. In (a) to (d) blue colour indicated pre-samples, yellow colour indicated post-samples. In (e), different colour of node and dotted-line indicated different individual, and the black dotted-line indicated the overall association. In (f) and (g), four colour indicated four degrees of anger and adequate sleep frequency.

