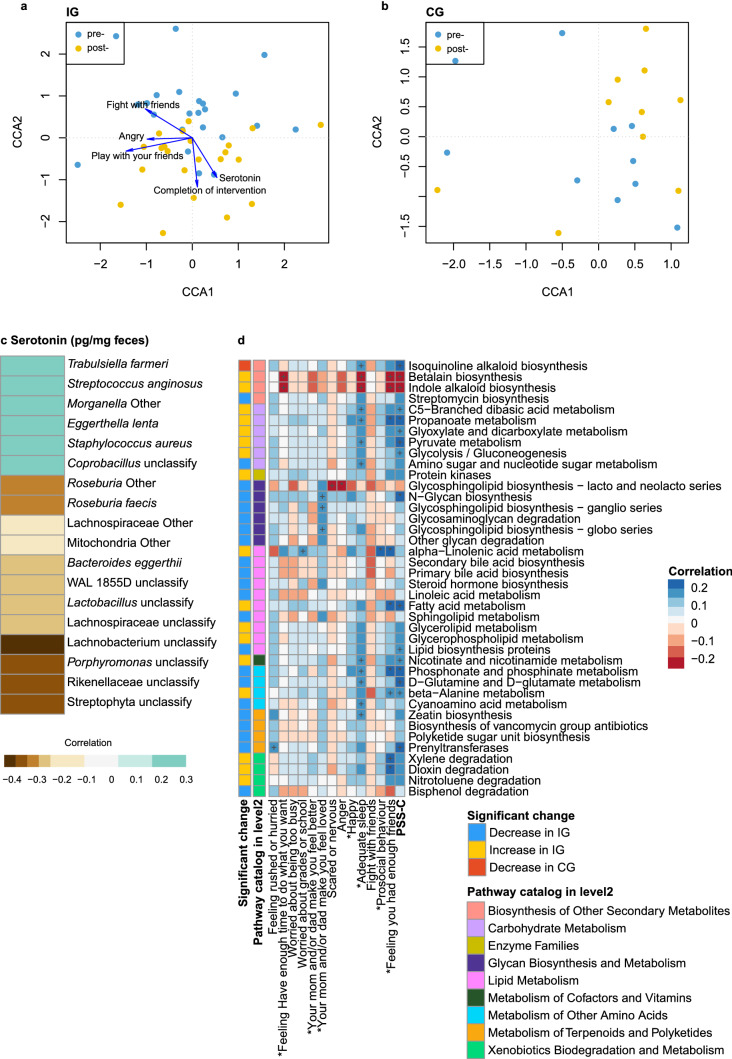
Figure 4.
Associations between serotonin, stress items and gut microbiome. (a) and (b) Canonical Correlation Analysis (CCA) in CG and IG samples. Blue node indicated the pre-intervention samples; yellow node indicated the post- samples. (c) Heatmap of correlations between serotonin and gut microbiota species. Only the significant associated factors on gut microbiota in spearman correlation were listed. Colour in each cell of the heatmap indicated spearman correlation of serotonin and species abundance. Only the p value of association less than 0.05 were chosen for display in this figure. (d) Associations between gut microbiota functions and stress items, and changes in microbiota functions by the intervention. The heatmap indicated the spearman correlation between metabolic functions of gut microbiota and children’s stress items. +p value less than 0.1; *p value less than 0.05; **p value less than 0.01. *in the front of the column name indicated we used the reversed score rather than the original score.

