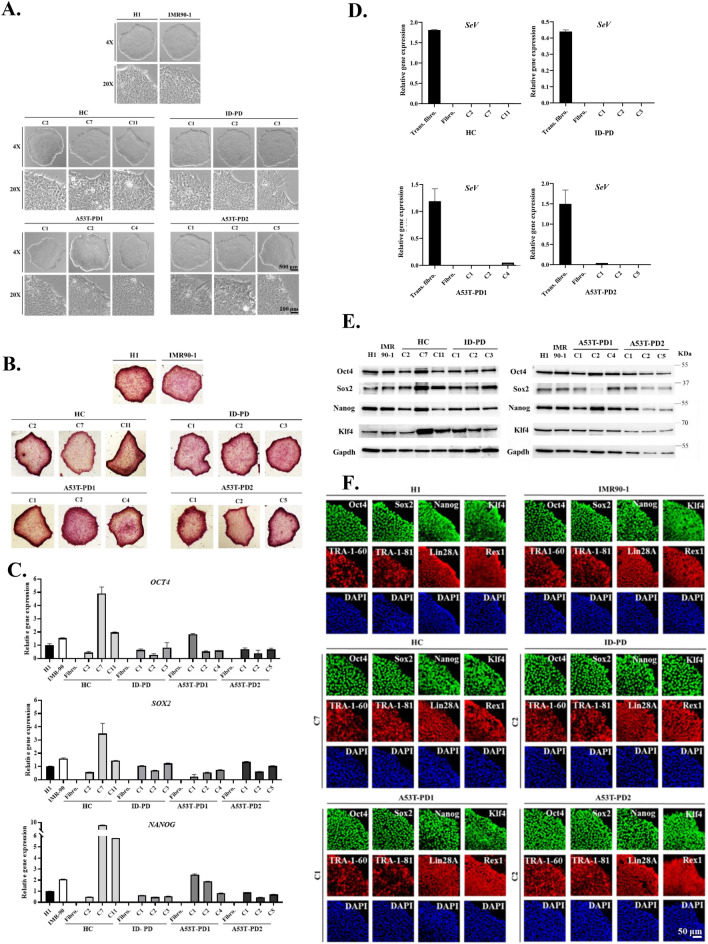
Figure 2.
Generated iPSCs that showed different reprogramming capacity exhibited similar pluripotent characteristics. (A) Represents the ESC-like morphology of the established iPSCs in comparison to H1 and IMR90-1 cells which was observed by light microscopy using 2 different magnifications (× 4 and × 20). (B) Represents the alkaline phosphatase expression that was expressed by the established iPSC colonies compared to that expressed by H1 and IMR90-1 cells. Microscopic images were taken using × 10 magnification. (C) Representative graphs for RT-qPCR analysis of pluripotent genes that were expressed by the generated iPSCs and those expressed levels were compared with reference expressions represented by H1 and IMR90-1. (D) Representative graphs for expression levels of SeV-derived genes. Each graph represents one of the reprogrammed samples (HC, ID-PD, A53T-PD1 and A53T-PD2). Expression levels of pluripotent genes and SeV-derived genes were normalized by the expression of GAPDH as an endogenous control gene and the original fibroblasts were used as negative control for detected genes. Fibro: fibroblasts; Trans. fibro.: transduced fibroblasts on day 7 post transduction. (E) Represents Western blot analysis that shows the expression levels of pluripotent proteins [Oct4 (~ 45 KDa), Sox2 (~ 34 KDa), Nanog (~ 40 KDa), and Klf4 (~ 65 KDa)] that were expressed in the established iPSC colonies and in reference cells H1 and IMR90-1. Left panel shows the proteins expressed in HC and ID-PD colonies; while the right panel indicates the proteins expressed in A53T-PD1 and A53T-PD2 colonies. Gapdh was used as a loading control. Full-length blots are presented in Supplementary Fig. 2. (F) Representative immunofluorescence microscope images of pluripotent markers that were expressed by the generated iPSCs. [Oct4, Sox2, Nanog and Klf4] are represented in green, while [Lin28A, Rex1, TRA-1–60 and TRA-1–81] are represented in red. DAPI marks nuclei (blue). One representative colony from each reprogrammed sample in reference to H1 and IMR90-1 cells is illustrated in this figure. HC (C7), ID-PD (C2), A53T-PD1 (C1) and A53T-PD2 (C2).

