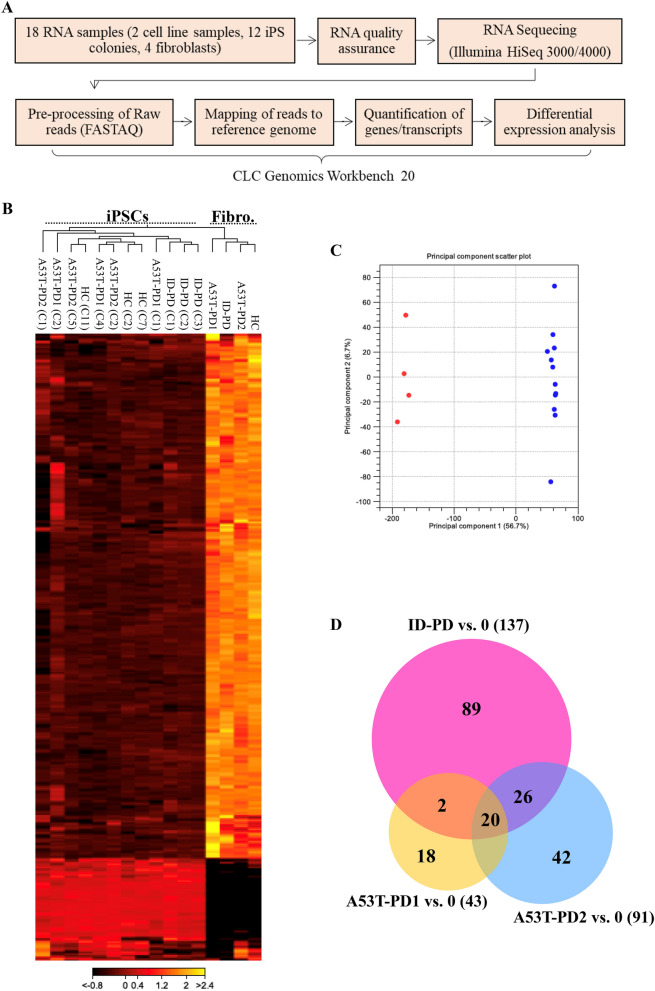
Figure 3.
RNA-sequencing identifies transcriptional changes between fibroblasts and iPSCs samples. (A) Flowchart of the RNA-Seq and downstream analysis. (B) Heatmap analysis for the genes expression levels that showed unique cluster for iPS cell lines and another unique cluster for fibroblasts. (C) Two dimensional PCA analysis that shows similarities among fibroblasts and iPS cells; dots highlighted in red and blue represent fibroblasts and iPSCs gene sets; respectively. (D) Venn diagram of differentially expressed genes (FDR < 0.01, FC > 2) in the PD iPS cell lines (ID-PD, A53T-PD1 and A53T-PD2) versus control iPS cell line. “0” refers to IMR90-1.

