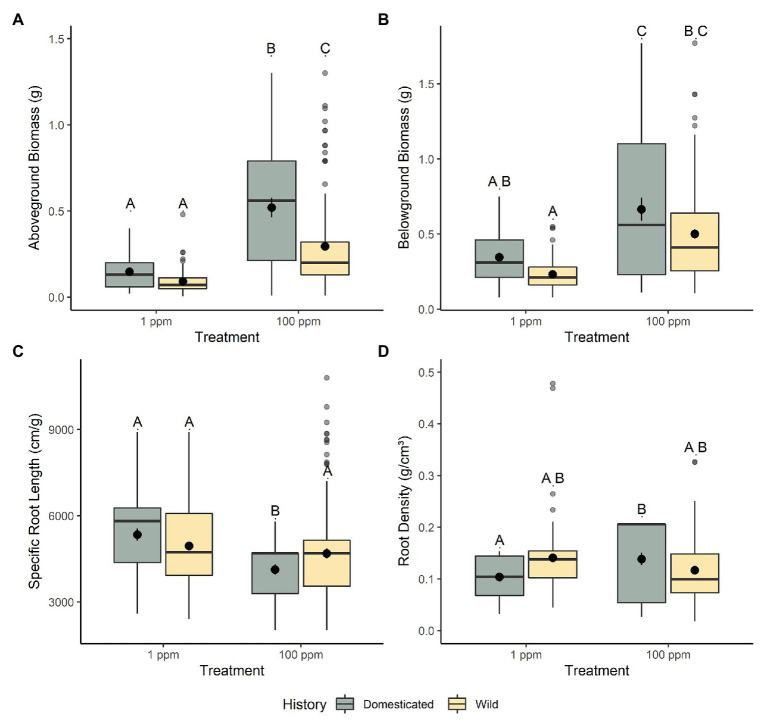
Figure 1.
The response of chickpea morphology to increased nitrogen availability. (A) Aboveground biomass, (B) belowground biomass, (C) specific root length (SRL), and (D) root density. Domesticated (yellow) and wild (green) chickpea accessions are grouped. Different letters indicate statistically significant differences, p < 0.05 (Tukey’s HSD test).

