
Figure 1.
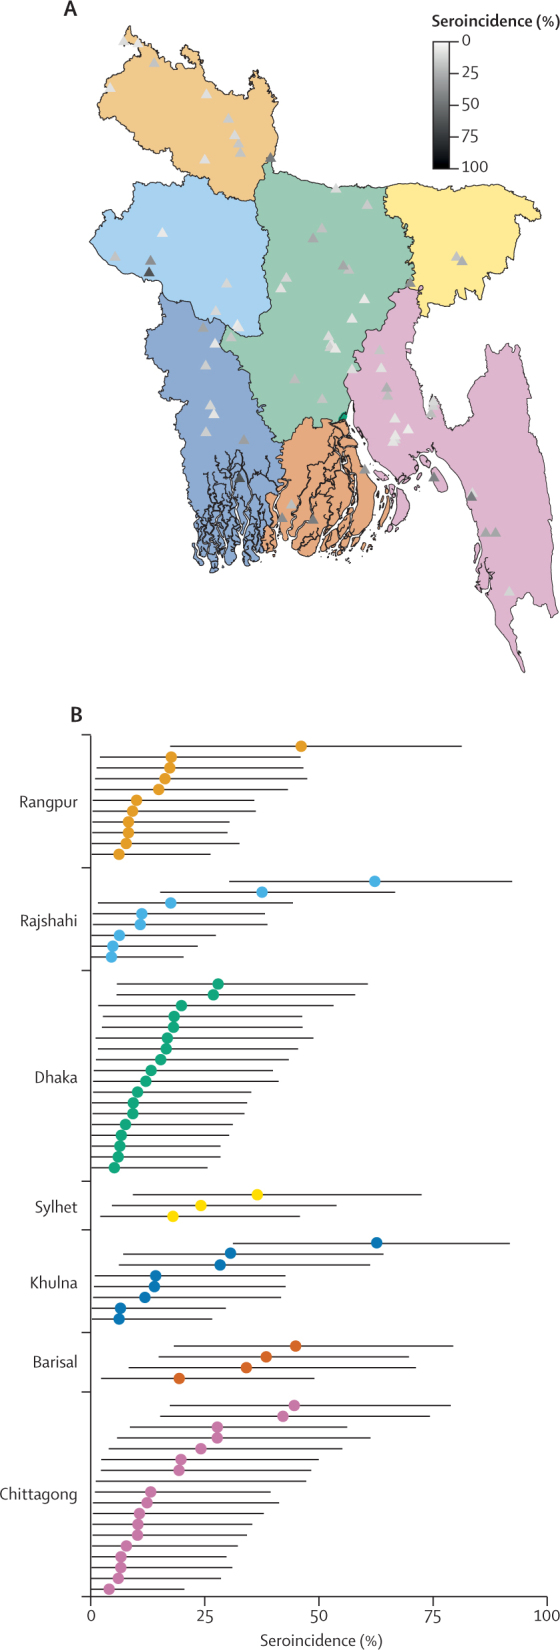
Location and seroincidence of sampled communities, by division
Map shows the location of each community, with different colours representing the seven divisions of Bangladesh and triangle shading representing the median seroincidence estimate (A). Plot shows seroincidence estimates and accompanying 95% credible intervals for each community, grouped by division (B); colours accord with those in (A).