
Figure 2.
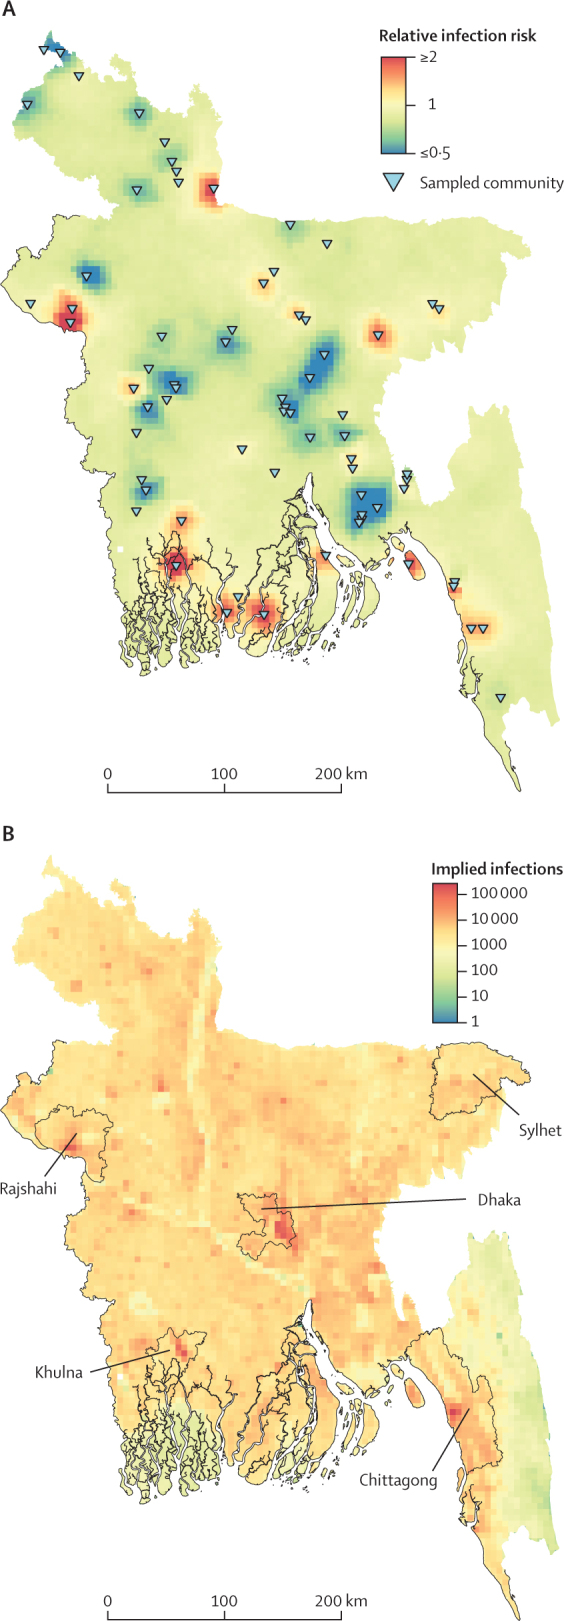
Relative risk of Vibrio cholerae O1 infection and estimates for the number of annual infections
Maps show the relative risk estimated at a 5 km × 5 km grid cell level (A) and infection estimates per 5 km × 5 km grid cell (B) across Bangladesh. Sampled sites are shown in triangles (A). The districts containing the five most populous cities in Bangladesh are labelled (B). The relative risk for each grid cell is estimated by applying integrated nested Laplace approximations with a Matern spatial covariance model to post-stratified predictions of sampled communities from a random forest model that are corrected for demographics (age and sex), the sampling design of the study, and sensitivity and specificity using a Bayesian hierarchical model.