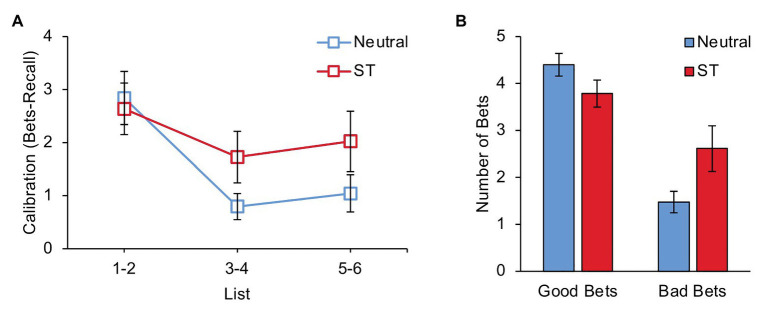
Figure 2.
(A) Average calibration score (number of items bet on minus number of items recalled) on lists 1–2, lists 3–4, and lists 5–6 for participants in the Neutral and Stereotype Threat groups. (B) Average number of successful (“good”) and unsuccessful (“bad”) bets during lists 3–6 for participants in the Neutral and Stereotype Threat groups. ST, Stereotype Threat. Error bars represent standard error of the mean.

